As a kid, I always enjoyed Halloween. I would dress up in some particularly fun costume, usually something scary. As I went from house to house gathering candy with my friends, I would often see someone’s carved pumpkin lying in the road, clearly a victim of some hooligan’s prank. It was a reminder that, even in good times, negative influences exist around us.
Today, as we approach the Halloween holiday, we wonder whether the rest of the year will find our meticulously carved pumpkin (stock and bond) portfolios smashed on Wall Street. Just as we see on Halloween, there are now many frightening and disturbing “tricks” in the economy today, and we’re hoping to safely make it home (the end of the year) to enjoy what “treats” we hope to have in our investment bags.

Part 1: Looking back at Q3 2023
Part 2: What actions did we take in McKinley Carter portfolios last quarter?
Part 3: A look ahead - our outlook for the rest of 2023
Looking back at Q3 2023
As a kid, I always enjoyed Halloween. I would dress up in some particularly fun costume, usually something scary. As I went from house to house gathering candy with my friends, I would often see someone’s carved pumpkin lying in the road, clearly a victim of some hooligan’s prank. It was a reminder that, even in good times, negative influences exist around us.
Today, as we approach the Halloween holiday, we wonder whether the rest of the year will find our meticulously carved pumpkin (stock and bond) portfolios smashed on Wall Street. Just as we see on Halloween, there are now many frightening and disturbing “tricks” in the economy today and we’re hoping to safely make it home (the end of the year) to enjoy what “treats” we hope to have in our investment bags.
Tricks:
- Rising interest rates for mortgages, credit cards, car loans, business loans, etc. make it more difficult for consumers and businesses. Stock prices are struggling in the face of stronger competition from higher bond yields.
- Gasoline prices have been rising due to production cuts by OPEC, Saudi Arabia, and Russia.
- Pandemic stimulus money is running out.
- Student loan payments are restarting after a three-year pause.
- Federal funding for day care programs is ending, affecting up to 3.2 million children.
- Banks have severely curtailed lending.
- Auto workers are on strike.
- Congress is in turmoil over funding the government in light of the country’s $33 trillion debt burden, and the Treasury Department is increasing their estimates for the amount of new Treasury bonds that must be issued to finance government operations.
- Global growth is sluggish.
Fortunately, we have a number of “treats” that keep us modestly optimistic about the fourth quarter:
- The Federal Reserve is likely near the end of their interest rate hiking cycle – this tends to bode well for stocks going forward as markets anticipate the first rate cut in 2024.
- Unemployment is still quite low and job openings are plentiful.
- Wage growth is above inflation, so consumers are still motivated to spend.
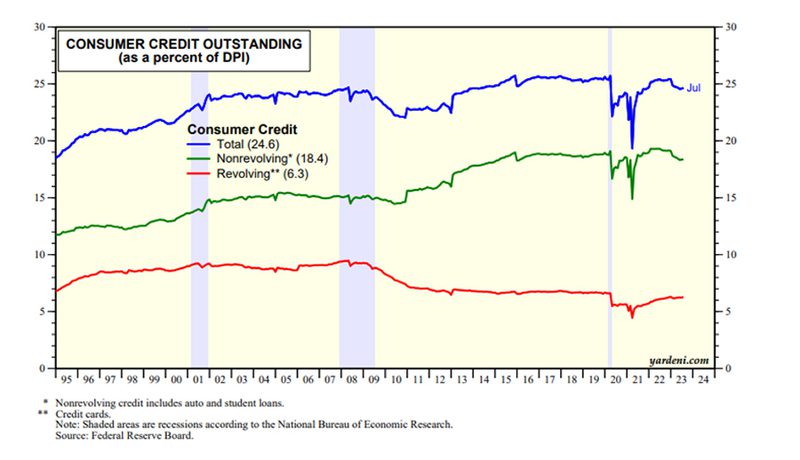
- Consumers’ debt, as a percentage of their disposable income, remains stable.
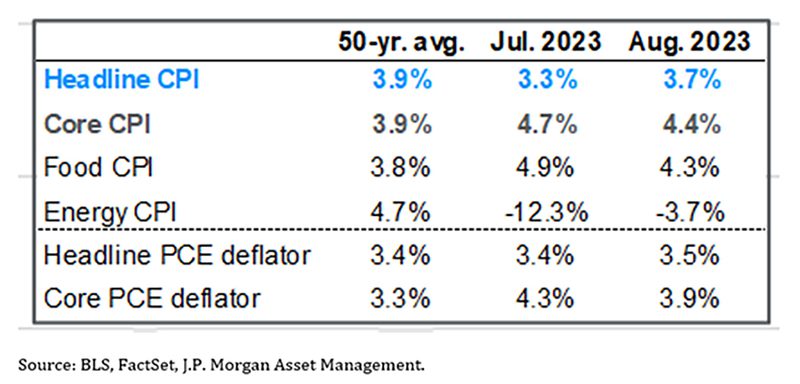
- Core Inflation has steadily dropped since June of 2022.
- Q3 GDP estimates are rising.
- Corporate earnings continue to come in ahead of estimates and Q4 projections show the first positive year-over-year comparisons in a year.
- Despite the expensive valuations found in a handful of the largest stocks in the S&P 500, the average stock in the index is trading at a much more reasonable level.
The Key Events of the Quarter
The S&P 500 rose to the highest level since March 2022 early in the third quarter but rising global bond yields, fears of a rebound in inflation and concerns about a future economic slowdown weighed on the major indices in August and September and the S&P 500 finished the third quarter with a modest loss.
The S&P 500 started the third quarter largely the same way it ended the second quarter – with gains. Stocks rose broadly in July thanks primarily to “Goldilocks” economic data, meaning the data showed solid economic growth but not to the extent that would have implied the Federal Reserve needed to hike rates further than investors expected. That solid economic data combined with a decline in inflation metrics to further boost stock prices, as investors embraced reduced near-term recession risks and steadily declining inflation. The Federal Reserve, meanwhile, increased interest rates in late July but also signaled that could be the last rate hike of the cycle. That tone and commentary further fueled optimism that one of the most aggressive rate hike cycles in history was soon coming to an end.
Finally, Q2 earnings season was better-than-feared with mostly favorable corporate guidance which supported expectations for strong earnings growth into 2024. The S&P 500 rose to the highest level since March 2022 and the index finished with a strong monthly gain of more than 3%.
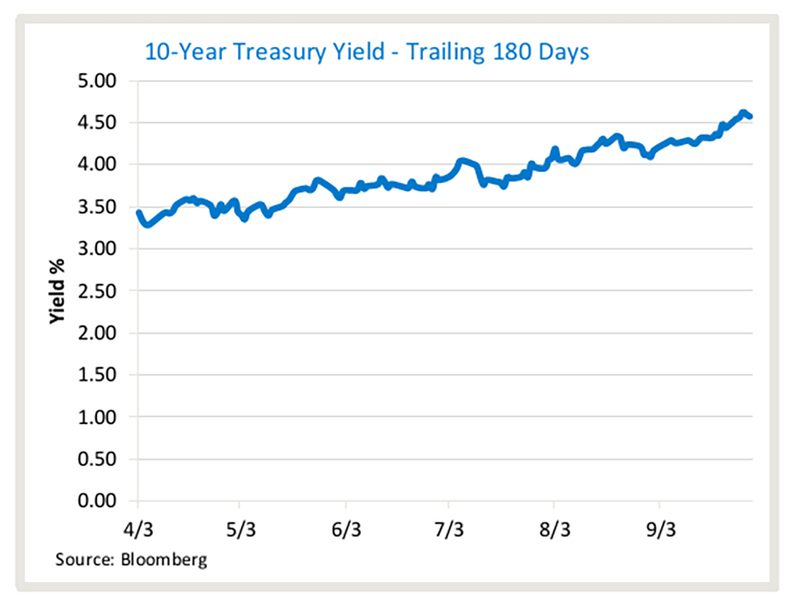
The market dynamic changed on the first day of August, however, when Fitch Ratings, one of the larger U.S. credit rating agencies, downgraded U.S. sovereign debt. Fitch cited long-term risks of the current U.S. fiscal trajectory as the main reason for the downgrade, but while that lacked any near-term specific justification for the downgrade, the action itself put immediate downward pressure on U.S. Treasuries, sending their yields meaningfully higher. The Fitch downgrade kickstarted a rise in Treasury yields that lasted the entire month, as the downgrade combined with a rebound in anecdotal inflation indicators and a large increase in Treasury sales stemming from the debt ceiling drama pushed yields sharply higher. The 10-year Treasury yield rose from 4.05% on August 1st to a high of 4.34% on August 21st, the highest level since mid-2007. That rapid rise in yields weighed on stock prices throughout August and the S&P 500 posted its first negative monthly return since February, as higher rates pressured equity valuations and raised concerns about a future economic slowdown. The S&P 500 finished August down 1.59%.
The August volatility subsided in early September, however, as solid economic data and a pause in the rise in Treasury yields allowed the S&P 500 to stabilize through the first half of the month. But volatility returned following the September Fed decision as the FOMC delivered markets a “hawkish” surprise, despite not increasing interest rates. Specifically, the majority of Fed members reiterated that they anticipated the need for an additional rate hike before the end of the year and forecasted only two rate cuts for all of 2024, down from four rate cuts forecasted at the June meeting. Then, late in the month, two additional developments weighed further on both stocks and bonds. First, the United Auto Workers labor union began a general strike, a move that would disrupt automobile production and temporarily weigh on economic growth. Second, the U.S. careened towards another government shutdown as Republicans and Democrats failed to agree on a “Continuing Resolution” to fund the government. The shutdown was avoided at the last minute, but the funding extension only lasts until November 17th meaning there will likely be another budget battle in the coming months. The S&P 500 declined towards the end of the month to hit a fresh three-month low, ending September down modestly.
In sum, volatility returned to markets during the third quarter, as rising bond yields pressured stock valuations, some inflation indicators pointed to a bounce back in inflation and the Fed reiterated a “higher for longer” interest rate outlook.
Third Quarter Performance Review
Rising bond yields were the main driver of the markets in the third quarter as high Treasury yields caused reversals in performance on a sector and index basis, relative to the first and second quarters.
- Starting with market capitalization, large caps once again outperformed small caps, as they did in the first two quarters of 2023, although both posted negative returns. That relative outperformance by large caps is consistent with rising Treasury yields, as smaller companies are typically more reliant on debt financing to sustain operations and rising interest rates create stronger financial headwinds for smaller companies when compared to their larger peers.
| U.S. Equity Indexes | Q3 Return | YTD |
|---|---|---|
| S&P 500 | -2.08% | 13.07% |
| DJ Industrial Average | -1.28% | 2.73% |
| NASDAQ 100 | -1.30% | 35.37% |
| S&P MidCap 400 | -3.57% | 4.27% |
| Russell 2000 | -4.76% | 2.54% |
Source: YCharts
- From an investment style standpoint, however, we did see a performance reversal from the first two quarters of the year as value outperformed growth in the third quarter, although both investment styles finished with a negative quarterly return. Rising bond yields tend to weigh more heavily on companies with higher valuations and since most growth funds overweight higher P/E tech stocks, those funds lagged last quarter. Value funds that include stocks with lower P/E ratios are less sensitive to higher yields, and as such, they outperformed in the third quarter.
- On a sector level, nine of the 11 S&P 500 sectors finished the third quarter with a negative return, which is a stark reversal from the broad gains of the second quarter. Energy was, by far, the best performing S&P 500 sector in the third quarter thanks to a surge in oil prices. Communications Services also finished Q3 with a slightly positive quarterly return on hopes integration of advanced artificial intelligence would boost search and social media companies’ future advertising revenues.
- Looking at sector laggards, the impact of rising bond yields was again clearly visible as consumer staples, utilities and real estate were the worst performing sectors in the third quarter. Those sectors offer some of the highest dividend yields in the market, but with bond yields quickly rising, those dividend yields become less attractive and investors rotated out of the high-dividend sectors and into less-volatile bond funds as a result.
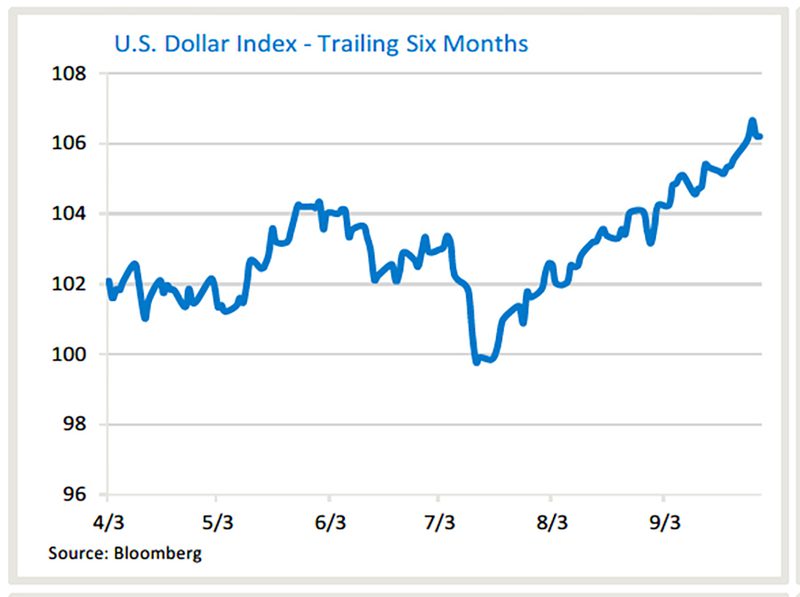
- Internationally, foreign markets saw moderate declines and again lagged the S&P 500 in the third quarter as disappointing economic data in Europe and China bolstered regional recession fears. Emerging markets did outperform developed markets, however, thanks to the announcement of larger-scale Chinese economic stimulus late in the quarter. Also, the spike in the value of the U.S. dollar (due to rising interest rates) pressured international stocks.
| International Equity Indexes | Q3 Return | YTD |
|---|---|---|
| MSCI EAFE TR USD (Foreign Developed) | -3.22% | 7.59% |
| MSCI EM TR USD (Emerging Markets) | -2.48% | 2.16% |
| MSCI ACWI Ex USA TR USD (Foreign Dev & EM) | -2.96% | 5.82% |
Source: YCharts
- Commodities saw substantial gains and were the best performing major asset class in the third quarter thanks to a significant rally in the energy complex. Oil rose throughout the quarter on continued supply concerns as Saudi Arabia and Russia extended voluntary supply cuts to the end of the year. Meanwhile, demand estimates rose late in the third quarter following the announcement of the large-scale Chinese stimulus plans, causing prices to rise sharply late in the quarter.
| Commodity Indexes | Q3 Return | YTD |
|---|---|---|
| S&P GSCI (Broad-Based Commodities) | 17.06% | 7.24% |
| S&P GSCI Crude Oil | 29.85% | 12.73% |
| GLD Gold Price | -3.10% | 1.40% |
Source: YCharts/Koyfin.com
- Gold, meanwhile, declined moderately thanks primarily to the stronger U.S. dollar, which rallied steadily over the course of the third quarter, hitting a fresh 2023 high in September.
- Switching to fixed income markets, the leading benchmark for bonds (Bloomberg Barclays U.S. Aggregate Bond Index) declined moderately for a second consecutive quarter as hawkish Fed rhetoric and hints of a rebound in inflation weighed broadly on fixed income markets. The yield on the 10-yr. Treasury bond rose during the quarter, taking 30-yr. mortgage rates higher as well.
Looking deeper into the bond markets, shorter-duration debt securities posted a positive quarterly return and outperformed those with longer durations in the third quarter, as the Fed did not signal it intended to raise interest rates any higher than previously expected. Longer-duration bonds, however, were pressured by the combination of a rebound in some inflation indicators and as investors digested that the Fed may well delay any rate cuts in 2024, keeping rates “higher for longer.”
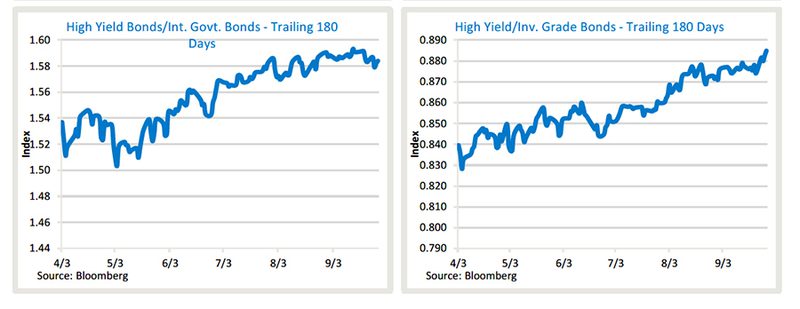
Turning to the corporate bond market, lower-quality but higher-yielding “junk” bonds rose slightly while higher-rated, investment-grade debt declined moderately in Q3.
The large performance gap reflected continued optimism from investors regarding future economic growth, as investors “reached” for higher yields offered by riskier companies amidst broadly rising bond yields.
| U.S. Bond Indexes | Q3 Return | YTD |
|---|---|---|
| BBgBarc US Agg Bond | -2.94% | -1.21% |
| BbgBarc US T-Bill 1-3 Mon | 1.36% | 3.71% |
| ICE US T-Bond 7-10 Year | -4.20% | -2.86% |
| BbgBarc US MBS (Mortgage-backed) | -3.84% | -2.26% |
| BbgBarc Municipal | -3.95% | -1.38% |
| BbgBarc US Corporate Invest Grade | -2.59% | 0.02% |
| BbgBarc US Corporate High Yield | 0.80% | 5.86% |
Source: YCharts
What actions did we take in McKinley Carter portfolios last quarter?
- Eliminated Cisco Systems (CSCO), Ecolab Inc (ECL), Pfizer Inc. (PFE), and Union Pacific Corporation (UNP) from the Dividend Focus (DF) models and replaced them with McDonald's Corporation (MCD), Illinois Tool Works Inc. (ITW), Merck & Co. Inc. (MRK), and Morgan Stanley (MS) due to better dividend growth rates.
- Also in DF models, the iShares International Select Div ETF (IDV), which scored poorly in our Fi360 analysis, was replaced by the Vanguard Intl Hi Div Yld Idx ETF (VYMI). The iShares Core MSCI Emerging Markets ETF (IEMG) was replaced with the GQG Partners Emerging Markets Equity Inv Fund (GQGPX) to have a greater focus on dividend yield.
- In ActiveTrack, Earnings Focus, Dividend Focus, and Hybrid fixed income models, we reduced by 55% our iShares 1-5 Year Investment Grade Corporate Bond ETF (IGSB) and moved the proceeds to the BlackRock Strategic Income Opportunities fund (BSIIX). Adding BSIIX allows us to be more agile in the fixed income space as we navigate the current rate environment. Our duration will increase modestly though it remains well below the duration found in the Bloomberg U.S. Aggregate Bond Index.
- Overall portfolio quality will remain intact though some additional high yield exposure will be added.
- The Invesco Aerospace and Defense ETF (PPA) was added to our approved tactical substitutes list.
A look ahead - our outlook for the rest of 2023
Markets begin the fourth quarter decidedly more anxious than they started the third quarter, but it’s important to realize that while the S&P 500 did hit multi-month lows in September and there are legitimate risks to the outlook, underlying fundamentals remain generally strong.
While there are reasonable concerns about a future economic slowdown, the latest economic data remains solid. Employment (low unemployment insurance claims), consumer spending and business investment were all resilient in the third quarter and there simply isn’t much actual economic data that points to an imminent economic slowdown.
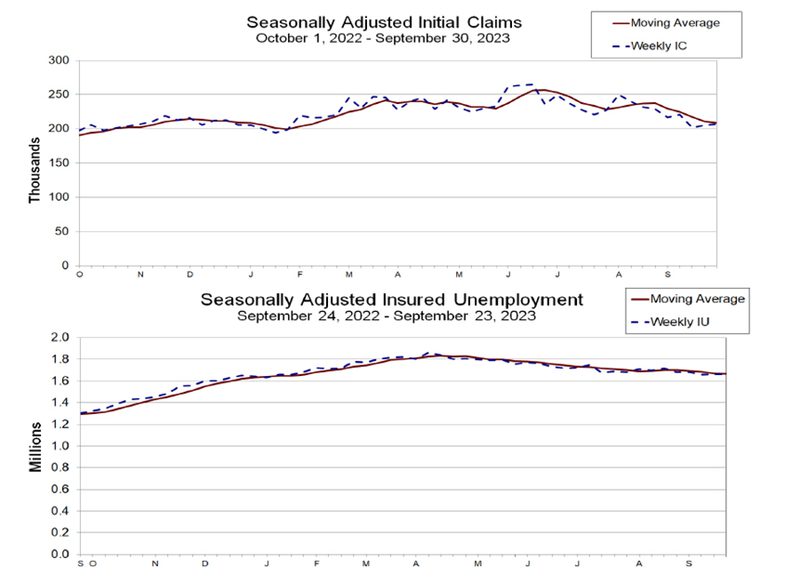
Source: U.S. Department of Labor
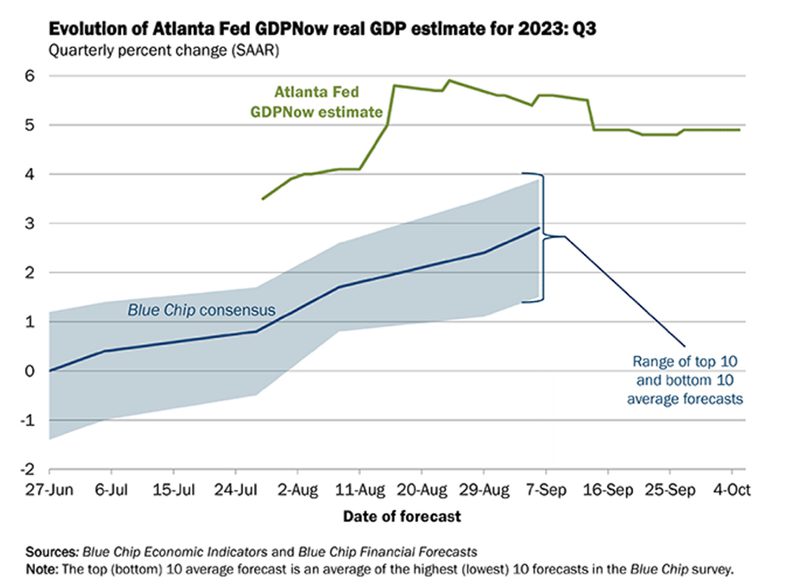
So, while a future economic slowdown is certainly possible given higher interest rates, increasing credit card delinquencies, the resumption of student loan payments, and declining U.S. savings, the actual economic data is clear: It isn’t happening yet. The Atlanta Federal Reserve’s estimate for third quarter GDP currently sits at a robust 4.9%, and consensus predictions for the quarter have been steadily rising.
However, recent credit card data may be foreshadowing stress on consumers. Total credit card debt has now exceeded $1 trillion dollars for the first time and credit card losses by issuers are rising at the fastest rate since 2008. In addition, consumers, which make up about two-thirds of the economy, have used up a large portion of their pandemic stimulus money and are facing a resumption of student loan debt repayments beginning in October.
While these factors are particularly painful for low-income consumers who rollover their monthly credit card balances, the overall picture for consumers is less worrisome. Credit card utilization as a percentage of spending has stayed steady and those consumers who are homeowners have seen their home values appreciate markedly in the past year. Another positive for U.S. consumers is the fact that debt to disposable personal income is no higher than levels seen between 2015 and 2019.
Additionally, the High Yield (“Junk”) bond market has been sharply outperforming government and investment grade corporate bonds of late, not the behavior typically seen if investors are worried about an imminent slowdown in the economy.
Regarding the stock and bond markets, we consider three factors to be most important.
- Inflation
- Interest rates
- Earnings
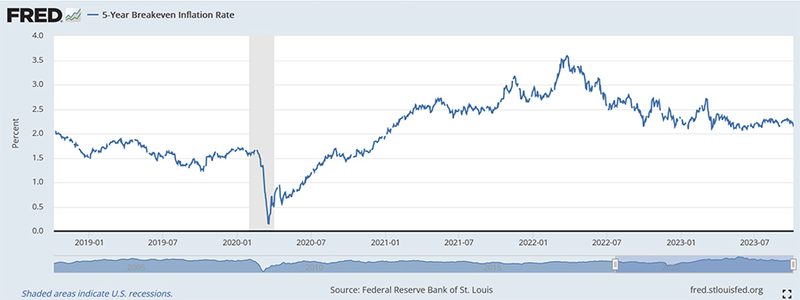
Fears that inflation may temporarily bounce back somewhat are legitimate, given the rally in oil prices in the third quarter. But the Federal Reserve and other central banks typically look past commodity-driven inflation and instead focus on “core” (ex. food and energy) inflation and that metric continued to decline throughout the third quarter. Additionally, declines in housing prices from the recent peak are only now beginning to work into the official inflation statistics, and that should see core inflation continue to move lower in the months and quarters ahead. Five-year inflation expectations (2.18%), as measured by the St. Louis Fed, continue to be subdued and are just above the Federal Reserve’s 2% inflation target.
Interest rates, a by-product of Federal Reserve action and economic growth expectations, have risen over the past year as the Fed has steadily increased short-term rates in an attempt to slow the economy. Longer-term rates have risen due to better-than-expected economic growth. Regarding monetary policy, the Federal Reserve’s historic rate hike campaign is nearing an end. And while we should expect the Fed to keep rates “higher for longer,” high interest rates do not automatically result in an economic slowdown. Interest rates have merely returned to levels that were typical in the 1990s and early 2000s, before the financial crisis, and the economy performed well during those periods. Yes, the risk of higher rates causing an economic slowdown is one that must be monitored closely, but for now, higher rates are not causing a material loss of economic momentum. Markets are now factoring in the possibility of a “soft landing” for the economy, which we believe is a likely outcome.
Lastly, over the past year, we maintained our position that corporate earnings were not going to be as bad as many feared. This was due to profit margins holding up as many companies passed on cost increases to consumers. Now that many input costs have started to decline, corporate earnings revisions have turned positive and that has led to greater confidence in an earnings rebound in 2024.
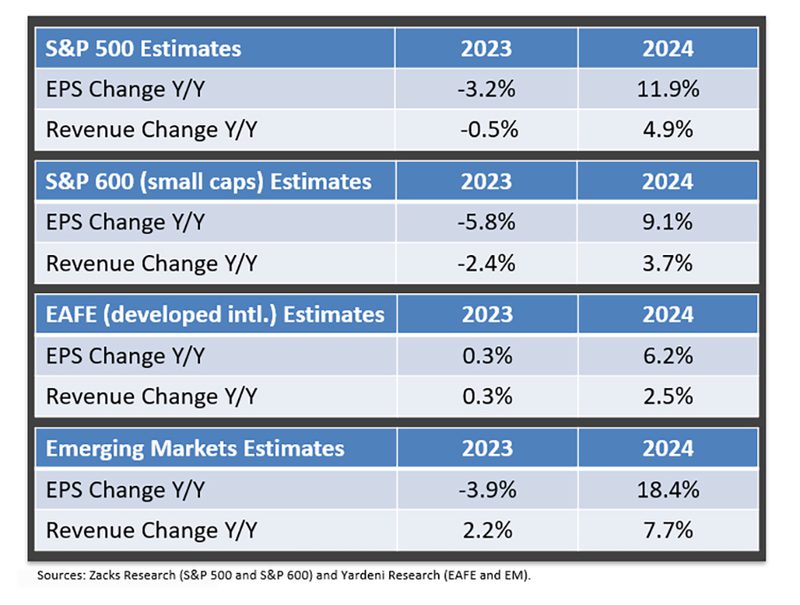
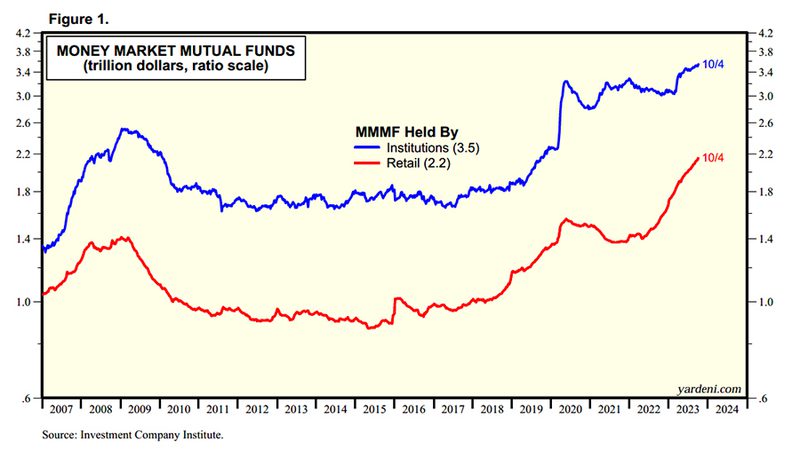
In the fourth quarter and over the next year, stocks will likely outperform bonds as economic conditions are generally positive, employment data remains solid, core inflation continues to subside, the Federal Reserve stops raising interest rates, and the stock market anticipates an earnings recovery in 2024. Bond yields have become very attractive and do present a near-term challenge to stock valuations, but as investors begin to factor in a lower interest rate environment in 2024, we believe they will move assets out of money market funds which have now reached an all-time high of $5.7 trillion dollars.
