Markets were volatile in the third quarter as investors faced political turmoil and increased uncertainty about future economic growth, but the return of Fed rate cuts and solid corporate earnings helped to offset those political and economic anxieties, and the S&P 500 hit another new all-time high and finished the quarter with strong gains. In the third quarter, we began to see other stocks (the 493) participate in the stock market’s rise. Learn more.
Part 1: Looking back at Q3 2024
Part 2: What actions did we take in McKinley Carter portfolios last quarter?
Part 3: A look ahead - our outlook for the rest of 2024
Looking back at Q3 2024
Markets were volatile in the third quarter as investors faced political turmoil and increased uncertainty about future economic growth, but the return of Fed rate cuts and solid corporate earnings helped to offset those political and economic anxieties, and the S&P 500 hit another new all-time high and finished the quarter with strong gains.
In our second quarter Huddle newsletter investment report entitled, “The Few. The Proud. The Elephants,” we showed that two-thirds of the first six months’ stock market returns were driven by seven large companies referred to as the “Magnificent 7.” However, in the third quarter we began to see other stocks (the 493) participate in the stock market’s rise. According to Morningstar, while the S&P 500 rose 5.9% in the quarter, the equal-weighted S&P 500 index and the equal-weighted Russell 1000 rallied 9.5%. Value stocks, small cap stocks, and Emerging Markets stocks also did well in Q3 (orange bars).
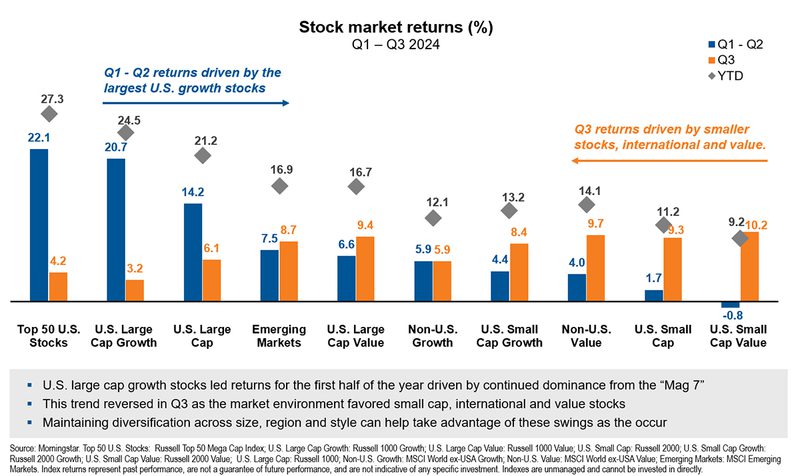
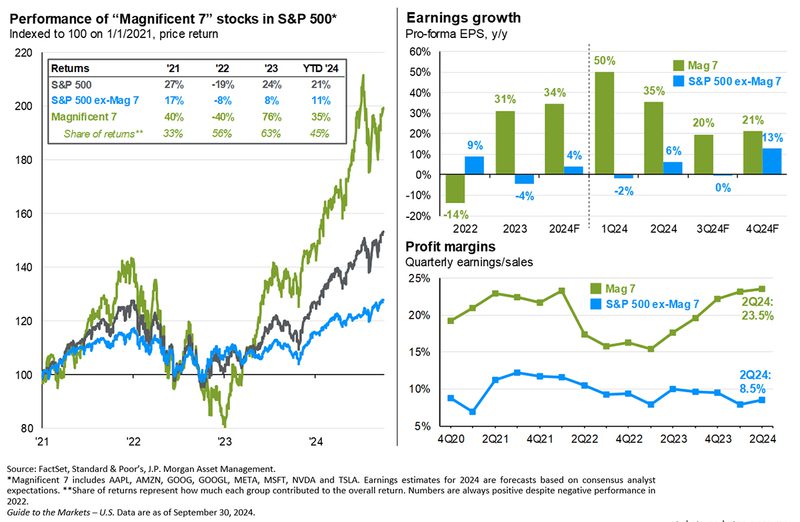
The Magnificent 7 components of the S&P rose just 2.5% (Morningstar data) for the period as investors focused on those stocks that were not as associated with the Artificial Intelligence theme that was so prevalent in the first half of the year. This was a healthy sign of a broadening market, not one dependent on a handful of large technology companies. However, YTD through September 30, not including dividends, the Magnificent 7 rose a robust 35% vs. the S&P’s gain of 21%.
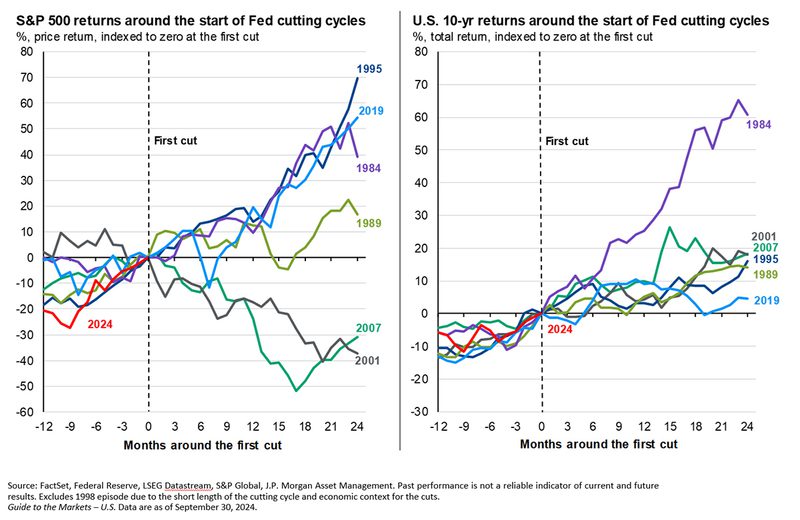
Highlighting the most significant financial event of the year, on September 18th, the Federal Reserve enacted its first interest rate cut since the early days of the Covid pandemic, slicing half a percentage point off benchmark rates in an effort to head off a slowdown in the labor market. As inflation continues to subside, the Fed has now turned its attention to the jobs market and their goal of a “soft landing” for the economy. Historically, in a non-recessionary environment like the one in which we currently find ourselves, stocks perform well subsequent to the first cut in the Fed Funds rate.
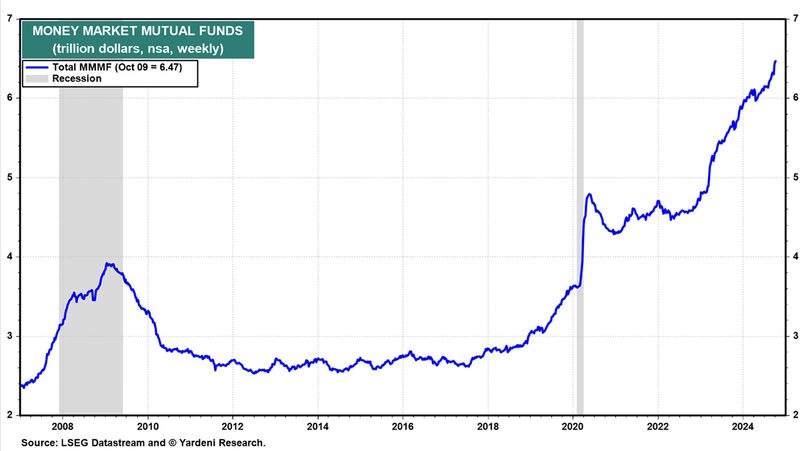
As a result of the Fed’s actions, money market fund yields have dropped, and shorter term bond yields are now below longer term bond yields for the first time in two years. With $6.5 trillion in money market funds outstanding, it’s reasonable to expect that investors may move some of those assets to the bond market and potentially the stock market as the Fed reduces the Federal Funds rate further this year and into 2025.
The Key Events of the Quarter
Markets started the third quarter with a continuation of the first-half rally thanks to good Q2 earnings results and generally solid economic data. However, while the S&P 500 hit a new all-time high in mid-July, the second half of the month proved more volatile. That volatility was driven by an intense rotation within the S&P 500 from the heavily weighted tech sector (more than 30% of the S&P 500) to other, smaller market sectors such as utilities, financials, and industrials. The impetus for this dramatic rotation was a combination of profit taking following the substantial AI-driven tech stock rally and a larger-than-expected decline in inflation which caused Treasury bond yields to fall sharply as investors anticipated imminent rate cuts by the Fed. That expectation boosted the economic outlook and caused investors to rotate towards market sectors that benefit more directly from a strong economy. So, while investors didn’t exit the market entirely, the decline in the tech sector weighed on the S&P 500 and was not fully offset by gains in other, smaller market sectors. The S&P 500 finished July well off the mid-month highs and with just a small gain, up 1.1%.
The late-July volatility continued in early August as a much-weaker-than-expected July jobs report, released on August 2nd, added to economic concerns. The unemployment rate rose to the highest level since November 2021 and investors’ fear of an economic hard landing triggered a sharp, intense decline that saw the S&P 500 fall 3% on Monday, August 5th, the worst one-day selloff in nearly two years. However, that decline proved brief as economic data over the next few weeks was generally solid and that helped calm investors’ anxieties. Then, on August 23rd, at the Kansas City Fed’s Jackson Hole Economic Symposium, Fed Chair Powell told markets the “time had come” for the Fed to cut rates. That all but guaranteed a rate cut at the September meeting. That message further fueled the rebound in stocks and the S&P 500 finished August with a 2.3% gain, completing an impressive rebound from early-month weakness.
The rally continued in September thanks to growing expectations for a large Fed rate cut that offset lackluster economic data. The August jobs report, released in early September, was another disappointment and again increased concerns about an economic slowdown and stocks were modestly volatile to start the month. However, following that report, numerous financial journalists and ex-Fed officials made public calls for the Fed to cut interest rates by 50 basis points at the September meeting and expectations for a larger-than-expected rate cut helped offset underwhelming economic data and the S&P 500 hit a new all-time high ahead of the Fed decision. Then, on September 18th, the Fed met market expectations and cut rates for the first time in four years and promised additional rate cuts between now and year-end. Investors welcomed this news and the S&P 500 surged to a new high and finished the month and quarter with more solid gains, adding to the strong year-to-date return.
Finally, politics and the looming presidential election did impact markets during the third quarter. Investors started the quarter expecting a Trump victory and Republican control of Congress, based on polling following President Biden’s struggles at the June debate and after the failed assassination attempt on the former president. However, those expectations changed rapidly following Biden’s withdrawal from the race and nomination of Vice President Kamala Harris. As the third quarter ended, national polls slightly favored Harris while the outlook for the control of Congress remained uncertain.
Q3 Performance Review
Investor expectations for falling interest rates and bond yields were the major influences on index, sector, and factor performance during the third quarter, as markets were broadly positive but with some notable changes in leadership.
- Starting with market capitalization, small caps outperformed large caps for the first time in 2024 as investors rotated out of large-cap stocks and into more economically sensitive small caps, as they historically have received the most benefit from lower borrowing costs that come with falling interest rates.
- From an investment style standpoint, value handily outperformed growth, although both investment styles posted positive returns for the third quarter. The outperformance of value was evidence of the significant rotation we saw from the tech sector (which dominates most growth funds) to lower P/E and more economically sensitive parts of the market such as financials, industrials, utilities, and others.
- On a sector level, nine of the 11 S&P 500 sectors finished the third quarter with a positive return and that continued the broad year-to-date rally we’ve all enjoyed. Evidence of the influence of lower yields on returns can be seen in the sector outperformers, as utilities and real estate, two sectors that have relatively large dividends and benefit when bond yields are falling, handily outperformed the remaining nine S&P 500 sectors.
- Looking at sector laggards, the tech and energy sectors were the only sectors to finish the third quarter with negative returns, as investors rotated out of tech and towards those higher dividend and more cyclically sensitive sectors. Energy, meanwhile, was the worst performing sector in the quarter as concerns about global growth (especially in China) weighed on oil demand expectations.
- Internationally, foreign markets outperformed the S&P 500 in the third quarter as the relative underperformance of the tech sector was a headwind on S&P 500 returns. Foreign developed markets saw a solid rally in the third quarter as investors anticipated additional rate cuts from the European Central Bank and other major global central banks. Emerging markets also outperformed the S&P 500 and foreign developed markets as the Chinese government announced numerous stimulus measures late in September and that boosted Chinese stocks and emerging market indices and ETFs.
- Commodities were mixed, but in aggregate saw moderate losses in the third quarter thanks mostly to weakness in oil prices. Oil declined sharply in Q3 as global demand expectations were reduced courtesy of soft Chinese economic data early in the quarter and on generalized global growth concerns. Gold, however, staged a strong rally thanks to elevated geopolitical uncertainty and the weaker dollar, as gold hit a new all-time high in Q3.
- Switching to fixed income markets, the leading benchmark for bonds (Bloomberg US Aggregate Bond Index) saw a strong quarterly return thanks to a combination of falling inflation, mixed U.S. economic data and as investor’s anticipation of an aggressive rate cutting cycle from the Fed.
- Looking deeper into the bond markets, longer duration bonds handily outperformed those with shorter durations as investors reached for longer-term yield amidst falling inflation and underwhelming labor market data. Shorter duration bonds also saw a positive return, however, as investors anticipated the start of an aggressive rate-cutting cycle by the Fed.
- Turning to the corporate bond market, investment grade bonds outperformed lower quality “junk” bonds although both saw strong quarterly gains. For the first time in 2024, investors favored investment-grade bonds amidst increased economic uncertainty, as investors sought the safety of higher-rated bonds over increased yield.
| U.S. Equity Indexes | Q3 Return | YTD |
|---|---|---|
| S&P 500 | 5.89% | 22.08% |
| DJ Industrial Average | 8.72% | 13.93% |
| NASDAQ 100 | 2.12% | 19.97% |
| S&P MidCap 400 | 6.94% | 13.54% |
| Russell 2000 | 9.27% | 11.17% |
Source: YCharts
| International Equity Indexes | Q3 Return | YTD |
|---|---|---|
| MSCI EAFE TR USD (Foreign Developed) | 7.33% | 13.50% |
| MSCI EM TR USD (Emerging Markets) | 8.88% | 17.24% |
| MSCI ACWI Ex USA TR USD (Foreign Dev & EM) | 8.17% | 14.70% |
Source: YCharts
| Commodity Indexes | Q3 Return | YTD |
|---|---|---|
| S&P GSCI (Broad-Based Commodities) | -5.26% | 5.23% |
| S&P GSCI Crude Oil | -16.44% | -4.74% |
| GLD Gold Price | 13.26% | 27.53% |
Source: YCharts/Koyfin.com
| U.S. Bond Indexes | Q3 Return | YTD |
|---|---|---|
| Bloomberg US Agg Bond | 5.20% | 4.45% |
| Bloomberg US T-Bill 1-3 Mon | 1.36% | 4.08% |
| ICE US T-Bond 7-10 Year | 5.74% | 4.26% |
| Bloomberg US MBS (Mortgage-backed) | 5.53% | 4.50% |
| Bloomberg Municipal | 2.71% | 2.30% |
| Bloomberg US Corporate Invest Grade | 5.84% | 5.32% |
| Bloomberg US Corporate High Yield | 5.28% | 8.00% |
Source: YCharts
What actions did we take in McKinley Carter portfolios last quarter?
- We increased our bond portfolio duration and expanded the use of managed bond funds to take advantage of unique opportunities across the bond spectrum. We accomplished this by eliminating the iShares 1-5 Year Investment Grade Corp Bd ETF (IGSB) and adding to the Fidelity Total Bond ETF (FBND) and the BlackRock Strategic Income Opps Fund (BSIIX).
- We increased exposure to domestic small cap stocks by adding to our positions in the iShares Core S&P Small-Cap ETF (IJR) and the Dimensional US Targeted Value ETF (DFAT) and reducing positions in the iShares Russell Top 200 ETF (IWL) and the iShares S&P 500 Value ETF (IVE). This was done to bring our small cap holdings up to a market weight in advance of the Federal Reserve’s rate cutting cycle.
- In our Tacticals sleeve, we added the Energy Select Sector SPDR® ETF (XLE) and eliminated the Consumer Staples Select Sector SPDR® ETF (XLP) in order to add more cyclical exposure as the Fed begins its rate cutting cycle.
- In our Dividend Focus model, we eliminated U.S. Bancorp (USB) and Sysco (SYY) due to slowing dividend growth rates and added Bank of New York (BK) and NextEra Energy (NEE).
- We eliminated our small cap international ETF, the iShares MSCI Intl Small-Cap Fund (ISCF), and added additional exposure to our other developed market ETFs in order to increase our quality bias in the international sleeve.
A look ahead - our outlook for the rest of 2024
Regarding the overall investment environment, we continue to focus on the stability of the market’s “three-legged investment stool.” Those legs are inflation, interest rates, and corporate earnings, and their relative changes impact the overall health of the stock and bond markets.
Inflation:
Looking at inflation trends in the third quarter, both the Consumer Price Index and the Federal Reserve’s favorite inflation gauge, the Core Personal Consumption Expenditures, or PCE index, reported good results. Through August, the year-over-year change in the Core PCE was 2.7% and the three-month increase was only 2%.
We continue to monitor inflation very closely as market expectations are for a persistent easing in inflation trends which then contributes to moderating interest rates and ongoing support for stock and bond prices.

Source: LSEG Datastream and Yardeni Research
Interest rates:
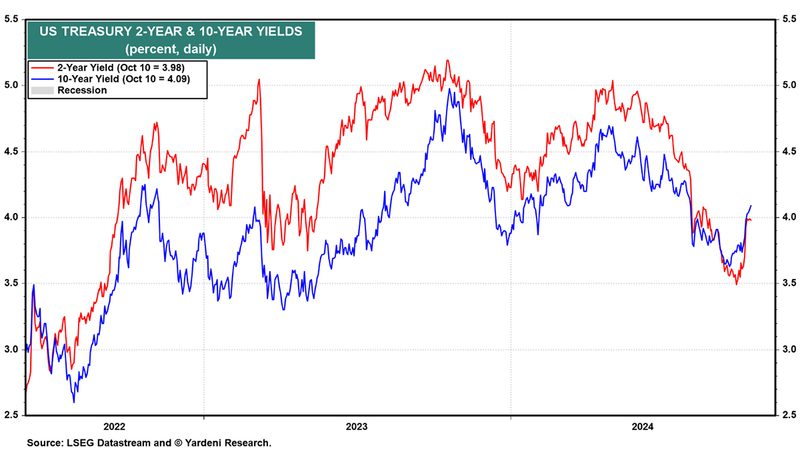
Regarding the interest rate outlook, the 10-yr. U.S. Treasury bond yields peaked in late April at 4.7% and have dropped back to 4%, helping bond prices rise and providing less competition for stocks. 2-yr. Treasury note yields also peaked in late April at a rate of 5% and are now yielding 4% as well.
The Fed’s guidance for the remainder of 2024 is for another half of one percent drop in the Fed Funds rate which should bring the 2-yr. Treasury yield down from here. The 10-yr. Treasury yield may remain range bound unless economic activity slows down markedly. With the increase in bond prices this year, we prefer to invest in bonds maturing in the 5- to 6-yr. range where yields are still relatively high and downside risks are minimal.
Earnings:
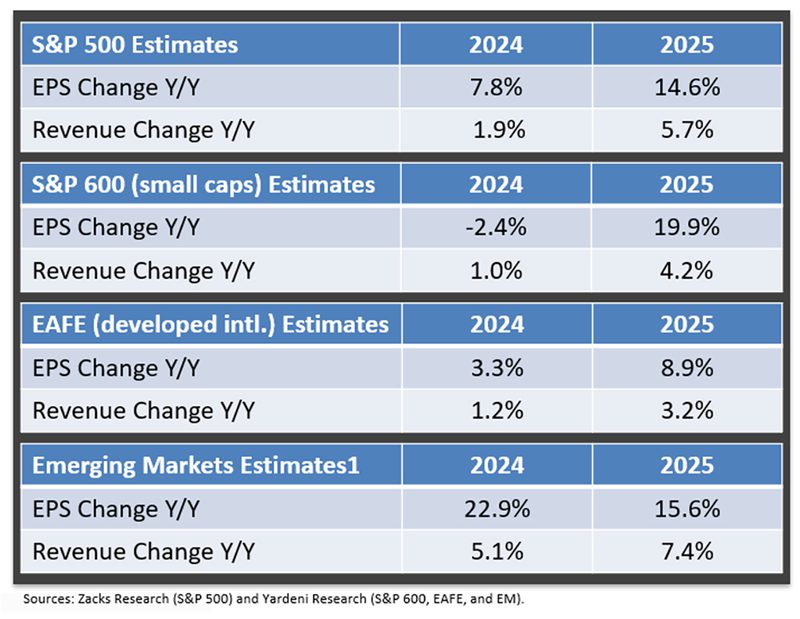
On the earnings front, Zacks Investment Research expects total S&P 500 earnings for the third quarter of 2024 to be up 3% from the same period last year on 4% higher revenues.
However, recent earnings revisions for the third quarter have been negative. These negative revisions mean that the 8% estimate for calendar 2024 S&P earnings is solely dependent on fourth quarter results reaching double-digits. Should the fourth quarter estimates be reduced, the stock market may experience a pullback.
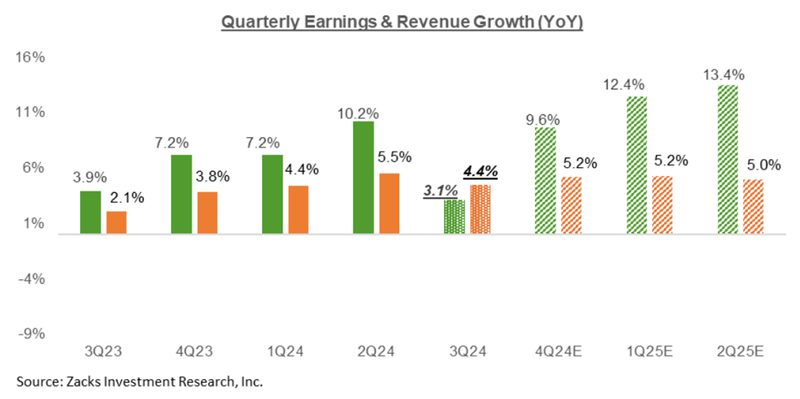
Looking at the calendar year 2025 picture, total S&P 500 earnings are expected to grow by nearly 15%. Next year’s earnings are also projected to be strong for small cap and international stocks. Additionally, corporate profit margins for companies remain elevated as productivity expands. The stock market will likely respond well should these estimates be maintained.
Taken together, the three legs of the markets’ investments stool serve to support our positive thesis on the direction of stock and bond prices. Slowing inflation data and unemployment above 4% are likely to allow the Federal Reserve to cut the Fed Funds rate twice before year-end with additional cuts in 2025.
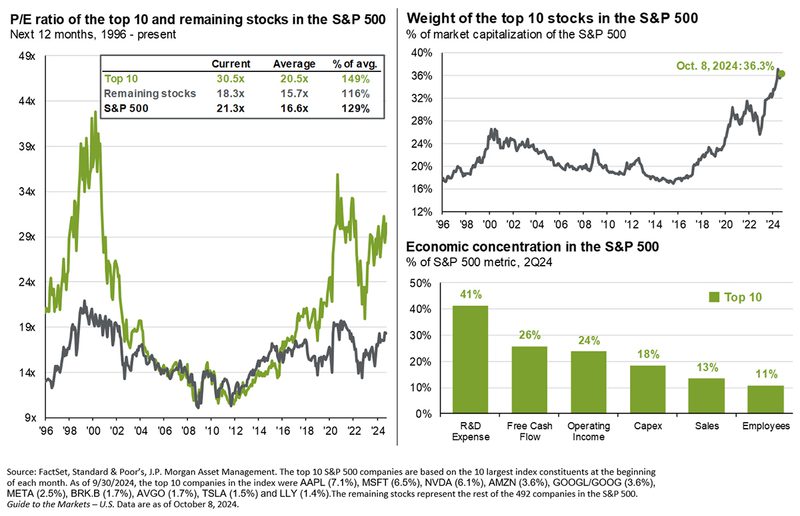
While the S&P 500 Index is expensive at 21.3x projected earnings, excluding the S&P’s ten largest holdings, the Price/Earnings Ratio (PE) is currently at a more modest 18.3x. Also, according to Morningstar, the equal-weighted S&P 500 ETF (RSP) has a PE of only 17.1x and the equal-weighted Russell 1000 ETF (EQAL) has a very reasonable PE of only 16.4x, indicating that the average stock is not expensive.
Politics, meanwhile, will become a more direct market influence as we approach the November 5th election. Depending on the expected and actual outcome, we could see an increase in macro and microeconomic volatility that could impact the broader markets as well as specific industries and sectors (e.g., oil and gas, renewables, financials, and others). That volatility will stem from the uncertainty surrounding potential future policy changes (or lack thereof) towards important financial and economic issues such as taxes, global trade, and the long-term fiscal health of the United States.
Finally, geopolitical risks remain elevated and while the war between Russia and Ukraine and the ongoing conflict between Israel, Hamas and now Hezbollah hasn’t negatively impacted global markets this year, that’s always a possibility and these situations must be consistently monitored as the spread of these conflicts would impact markets, regardless of any Fed rate cuts or election outcomes.
While the upcoming elections and global instability are certainly wild cards for the stock market, the fourth quarter is historically the best quarter for stocks. In fact, since 1950, the S&P 500 has increased by more than 4% in the last three months of the year according to Dow Jones Market data.
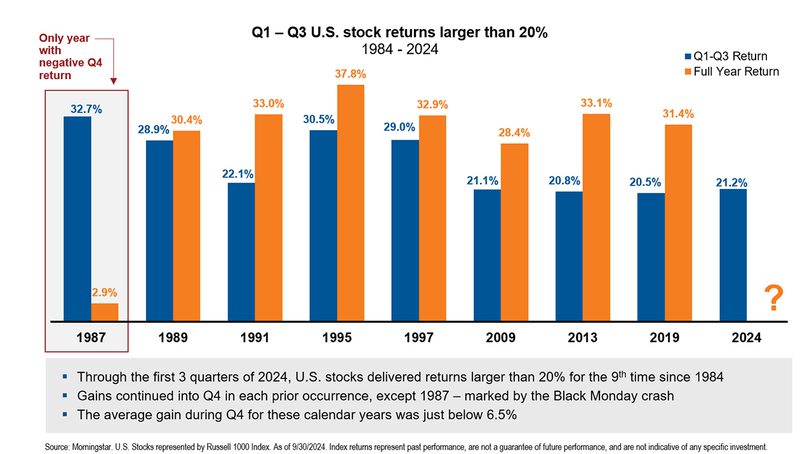
On a final note, in the past forty years, the S&P 500 has risen by more than 20% through the first nine months of the year nine times. In the previous eight occasions, the market has continued to rise in the final quarter seven times with an average gain of 6.5%.
