
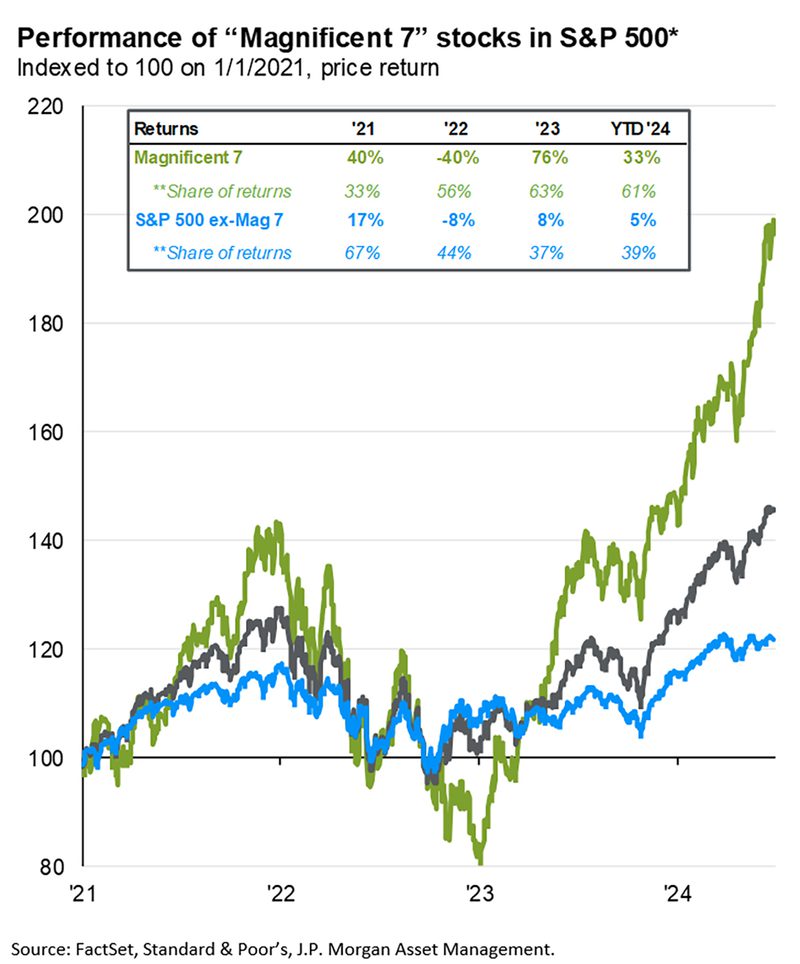
While "The Few, The Proud, The Marines" is a recruiting slogan for the U.S. Marine Corps, in the stock market, the “Few and the Proud” have been the “Magnificent 7” stocks (Nvidia, Apple, Amazon, Google, Microsoft, Meta, and Tesla) and their performance reminds one of the stampeding effects of charging elephants. Like these large pachyderms, the “Mag 7” have run roughshod over the broad stock market this year and have left most other stocks lagging far behind. Much of the excitement surrounding these companies is focused on their dominance in the Artificial Intelligence (AI) investment landscape. Learn more about our 2Q2024 market review.
Part 1: Looking back at Q2 2024
Part 2: What actions did we take in McKinley Carter portfolios last quarter?
Part 3: A look ahead - our outlook for the rest of 2024
Looking back at Q2 2024
While "The Few, The Proud, The Marines" is a recruiting slogan for the U.S. Marine Corps, in the stock market, the “Few and the Proud” have been the “Magnificent 7” stocks (Nvidia, Apple, Amazon, Google, Microsoft, Meta, and Tesla) and their performance reminds one of the stampeding effects of charging elephants. Like these large pachyderms, the “Mag 7” have run roughshod over the broad stock market this year and have left most other stocks lagging far behind. Much of the excitement surrounding these companies is focused on their dominance in the Artificial Intelligence (AI) investment landscape.
The “Mag 7” returned 33% for the first six months of 2024 with graphics chip maker Nvidia leading the way with a 150% gain. Excluding these seven stocks, the rest of the S&P 500 returned a modest 5% for the period. This compares to a gain of 15% for the combined S&P 500 index. The Dow Jones Industrial Average, which only includes one “Mag 7” member (Microsoft), saw a gain of 4.79%. Additionally, the equal-weighted S&P ETF (RSP) performed in line with the Dow as it rose 4.96% through the first two quarters of the year.
The Key Events of the Quarter*
The S&P 500 experienced its first real dose of volatility early in the second quarter, but expectations for interest rate cuts by the Federal Reserve, solid economic growth and continued strong financial performance from AI-related tech companies pushed the S&P 500 to new all-time highs and the index finished the quarter with strong gains.
While the S&P 500 hit new highs in the second quarter, the month of April was decidedly negative for markets as fears of no rate cuts in 2024 (or even a rate hike) pressured stocks. The catalyst for these concerns was the March Consumer Price Index (CPI), which rose 3.5% year over year, higher than estimates. That hotter-than-expected reading reversed several months of declines in CPI and ignited fears that inflation could be “sticky” and, if so, delay expected Fed rate cuts. Those higher rate concerns were then compounded by comments by New York Fed President John Williams, who stated rate hikes (which investors assumed were over) were possible if inflation showed signs of re-accelerating. The practical impact of the hot CPI report and William’s commentary was to push rate cut expectations out from June to September and that caused the 10-year Treasury yield to rise sharply, from 4.20% at the start of the quarter to a high of 4.72%. Those higher yields pressured the S&P 500 in April, which fell 4.08% and completed its worst month since September.
On the first day of May, however, the Fed dispelled concerns about potential rate hikes and ignited a rebound that carried the S&P 500 to new highs. At the May 1 Federal Open Market Committee (FOMC) decision, Fed Chair Powell essentially shut the door on the possibility of rate hikes, stating that if the Fed was concerned about inflation, it would just keep interest rates at current levels for a longer period instead of raising them. That comment provided immediate relief for investors and both stocks and bonds rallied early in May as rate hike fears subsided. Then, later in the month, the April CPI report (released in mid-May) rose 3.4% year over year, slightly lower than the 3.5% in March and that resumption of disinflation (the decline in inflation) further increased expectations for rate cuts in 2024. Additionally, employment data moderated in May, with the April jobs report coming in below expectations (but still at healthy levels). The practical result of the resumption of disinflation, the supportive Fed commentary and moderating labor market data was to increase September rate cut expectations, push the 10-year Treasury yield back down below 4.50% and spark a 4.96% rally in the S&P 500 in May.
The upward momentum continued in June thanks to more positive news on inflation, additional reassuring commentary from the Fed and strong AI-linked tech earnings. First, the May CPI (released in mid-June) declined to 3.3% year over year, the lowest level since February. Core CPI, which excludes food and energy prices, dropped to the lowest level since April 2021, further confirming ongoing disinflation. Then, at the June FOMC meeting, Fed Chair Powell reassured markets two rate cuts are entirely possible in 2024, reinforcing market expectations for a September rate cut. Economic data, meanwhile, showed continued moderation of activity and that slowing growth and falling inflation helped to push the 10-year Treasury yield close to 4.20%, a multi-month low. Finally, investor excitement for AI remained extreme in June, as strong AI-driven earnings from Oracle (ORCL) and Broadcom (AVGO) along with news Apple (AAPL) was integrating AI technology into future iPhones pushed tech stocks higher and that, combined with falling Treasury yields and rising rate cut expectations, sent the S&P 500 to new all-time highs above 5,500.
In sum, markets impressively rebounded from April declines and the S&P 500 hit a new high thanks to increased rate cut expectations, falling Treasury yields and continued robust earnings growth from AI-related tech companies.
Q2 Performance Review
The second quarter produced a more mixed performance across various markets than the strong return of the S&P 500 might imply, as AI-driven tech stock enthusiasm again powered the Nasdaq and S&P 500 higher while other major indices lagged. The Nasdaq was, by far, the best performing major index in the second quarter while the S&P 500, where tech is the largest sector weighting, also logged a solidly positive gain. Less tech-focused indices didn’t fare as well, however, as the Dow Jones Industrial Average and small-cap focused Russell 2000 posted negative quarterly returns.
- By market capitalization, large caps outperformed small caps in Q2, as they did in the first quarter of 2024. Initially, higher Treasury yields in April weighed on small caps, while late in the second quarter economic growth concerns pressured the Russell 2000.
- From an investment style standpoint, growth massively outperformed value in the second quarter, as tech-heavy growth funds once again benefited from continued AI enthusiasm. Value funds, which have larger weightings towards financials and industrials, posted a slightly negative quarterly return as the performance of non-tech sectors more reflected growing concerns about economic growth.
- On a sector level, performance was decidedly mixed as only four of the 11 S&P 500 sectors finished the second quarter with positive returns. The best performing sectors in the second quarter were the AI-linked technology and communications services sectors. They posted strong returns, aided by better-than-expected earnings results from NVDA, ORCL, AVGO, TSM, MSFT, AMZN and others as AI enthusiasm continued to push the broad tech sector and S&P 500 higher. Utilities also logged a modestly positive quarterly return, as the high yields and resilient business models were attractive to investors given rising concerns about future economic growth, while declining Treasury yields made higher dividend sectors such as utilities more attractive to income investors.
- Turning to the sector laggards, the energy, materials, and industrials sectors closed the quarter with modestly negative returns. Their declines reflected growing anxiety about future economic growth as those sectors, along with small-cap stocks, are more sensitive to changes in U.S. and global growth.
- Internationally, emerging markets outperformed the S&P 500 in Q2 thanks to optimism towards a rebound in Chinese economic growth and as falling global bond yields late in the quarter boosted the attractiveness of emerging market investments. Foreign developed markets, meanwhile, lagged both emerging markets and the S&P 500 and posted a fractionally negative quarterly return. Concerns about the timing and number of Bank of England and European Central Bank (ECB) rate cuts, along with French and German political concerns later in the quarter, acted as headwinds for foreign developed equities.
- Commodities saw slight gains in the second quarter thanks to optimism on Chinese economic growth and rising geopolitical concerns throughout the quarter. Gold rallied solidly on the uptick in geopolitical risks, following the tit-for-tat strikes between Israel and Iran, along with the growing chances of a direct Israel/Hezbollah conflict. Oil, meanwhile, logged a small loss on signs of slipping OPEC+ production discipline and concerns about future global growth and demand.
- Switching to fixed income markets, the leading benchmark for bonds (Bloomberg US Aggregate Bond Index) realized a slightly positive return for the second quarter, as rising expectations for a September Fed rate cut and moderating U.S. economic growth boosted bonds broadly.
- Looking deeper into the fixed income markets, shorter-duration bonds outperformed those with longer durations in the second quarter, as bond investors priced in sooner-than-later Fed rate cuts. Longer-dated bonds, meanwhile, were little changed on the quarter despite the return of disinflation and moderating U.S. economic growth.
- Turning to the corporate bond market, lower-quality, but higher-yielding “junk” bonds rose modestly in the second quarter while higher-rated, investment-grade debt logged only a slight decline in Q2. That performance gap reflected continued investor optimism towards corporate profits despite some disappointing economic reports, which led to bond investors taking more risk in exchange for a higher return.
| U.S. Equity Indexes | Q2 Return | YTD |
|---|---|---|
| S&P 500 | 4.28% | 15.29% |
| DJ Industrial Average | -1.27% | 4.79% |
| NASDAQ 100 | 8.05% | 17.47% |
| S&P MidCap 400 | -3.45% | 6.17% |
| Russell 2000 | -3.28% | 1.73% |
Source: YCharts
| International Equity Indexes | Q2 Return | YTD |
|---|---|---|
| MSCI EAFE TR USD (Foreign Developed) | -0.06% | 5.75% |
| MSCI EM TR USD (Emerging Markets) | 5.40% | 7.68% |
| MSCI ACWI Ex USA TR USD (Foreign Dev & EM) | 1.32% | 6.04% |
Source: YCharts
| Commodity Indexes | Q2 Return | YTD |
|---|---|---|
| S&P GSCI (Broad-Based Commodities) | 0.65% | 11.08% |
| S&P GSCI Crude Oil | -2.07% | 13.68% |
| GLD Gold Price | 4.47% | 12.60% |
Source: YCharts/Koyfin.com
| U.S. Bond Indexes | Q2 Return | YTD |
|---|---|---|
| BBg US Agg Bond | 0.07% | -0.71% |
| BBg US T-Bill 1-3 Mon | 1.34% | 2.68% |
| ICE US T-Bond 7-10 Year | -0.05% | -1.40% |
| BBg US MBS (Mortgage-backed) | 0.07% | -0.98% |
| BBg Municipal | -0.02% | -0.40% |
| BBg US Corporate Invest Grade | -0.09% | -0.49% |
| BBg US Corporate High Yield | 1.09% | 2.58% |
Source: YCharts
What actions did we take in McKinley Carter portfolios last quarter?
- We maintained our underweight of small cap stocks in the quarter as small cap earnings estimates continued to decline.
- We maintained our shorter duration exposure to bonds with the Federal Reserve having pushed out any interest rate cuts to the second half of the year.
- In our Earnings Focus model, we eliminated Starbucks (SBUX) and Accenture (ACN) due to earnings concerns and added Netflix (NFLX) and Accuity Brands (AYI).
- In our Dividend Focus model, we eliminated Clorox (CLX) due to a slowing dividend growth rate and added UnitedHealth Group.
- We lessened our overweight position in Emerging Markets relative to Developed Markets in order to bolster our position in Japanese stocks which are experiencing improving corporate earnings.
- In our fixed income models, we replaced the BlackRock Total Return Instl. Fund (MAHQX) with the Fidelity Total Bond ETF (FBND) to move our core bond allocation to an ETF with a lower expense ratio and better long-term performance.
A look ahead - our outlook for the rest of 2024
Regarding the overall investment environment, we are focused on the stability of the market’s “three-legged investment stool.” Those legs are inflation, interest rates, and corporate earnings, and their relative changes impact the overall health of the stock and bond markets.
Inflation:
Looking at inflation trends in the second quarter, both the Consumer Price Index and the Federal Reserve’s favorite inflation gauge, the core Personal Consumption Expenditures, or PCE index, reported improved results in the quarter. Encouragingly, despite the first quarter rise in the three-month rate of core PCE which excludes volatile food and energy prices, April and May data showed marked improvement. The year-over-year rate through May declined to a multiyear low of 2.6%. We continue to monitor inflation very closely as market expectations are for a persistent easing in inflation trends which then contributes to moderating interest rates and ongoing support for stock and bond prices.

Interest rates:
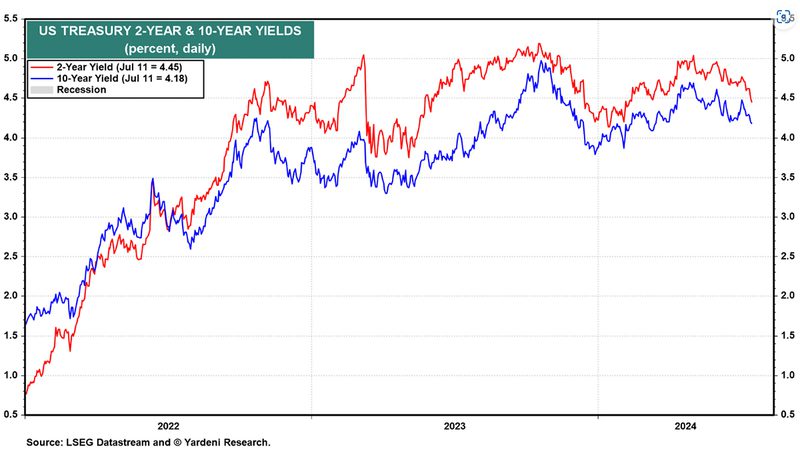
Aided by reduced inflation fears, the 10-yr. U.S. Treasury bond yields peaked in late April at 4.7% and have dropped back to 4.2%, helping bond prices rise and providing less competition for stocks. 2-yr. Treasury note yields also peaked in late April at a rate of 5% and are now yielding 4.5%. Generally, the 2-yr. Treasury yield is a harbinger of future Fed Funds rates over the next two years which would imply a drop in the Fed Funds rate of approximately 0.75% to 1.00%. The CME FedWatch tool now predicts the first Fed Funds rate cut in September, which bodes well for stock prices headed into the final quarter of the year.
Earnings:
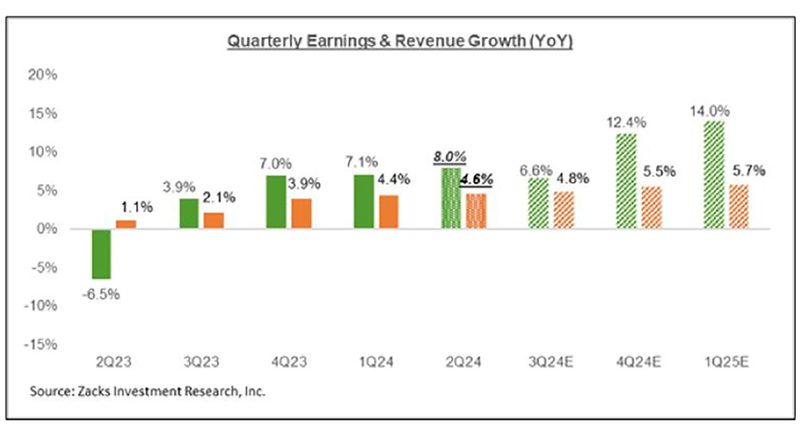
On the earnings front, total S&P 500 earnings for the second quarter of 2024 are expected to be up 8% from the same period last year on 4.6% higher revenues. This follows the 7.1% earnings growth on 4.4% higher revenues in the first quarter.
Positive earnings revisions for the S&P are being driven by improving profit margins. Helped by technology companies, consensus margin numbers are projected to increase each of the next three years.
Looking at the calendar year picture, total S&P 500 earnings are expected to grow by 9% this year with projections of 14% growth in 2025. Next year’s earnings are also projected to be strong for small cap and international stocks.
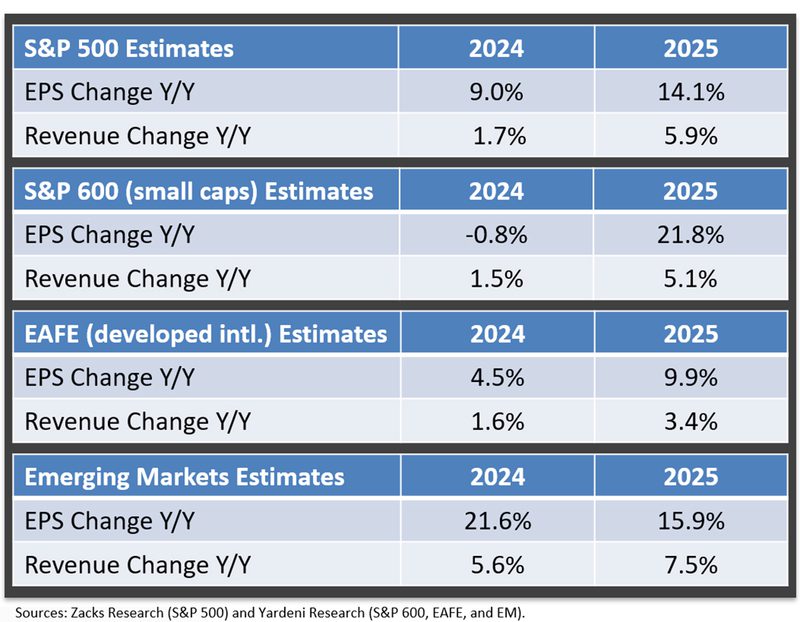
Taken together, the three legs of the markets’ “investments stool” are on firmer ground than they were three months ago and serve to support our positive thesis on the direction of stock and bond prices.
While longer term interest rates may remain elevated due to low unemployment, government borrowing, and positive GDP data, slowing inflation is likely to allow the Federal Reserve to cut the Fed Funds rate in the fall. Additionally, positive earnings projections may provide fuel for higher stock prices by the end of 2024.
While the S&P 500 Index is expensive at 21.4x projected earnings, excluding the S&P’s ten largest holdings, the Price/Earnings Ratio (PE) is currently only 17.0x, quite average relative to history. Also, the equal-weighted S&P 500 ETF (RSP) has a PE of only 17.2x, indicating that the average stock in the index is not expensive.
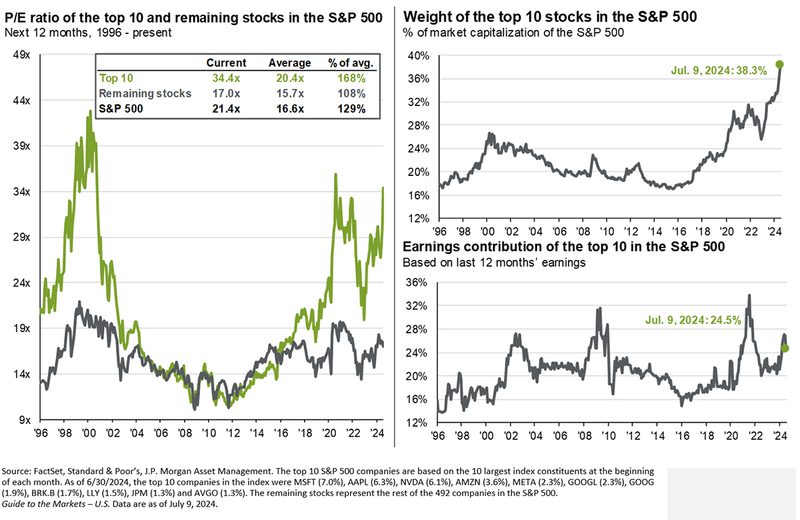
Additionally, international stocks are trading at an historically low valuation relative to U.S. stocks.
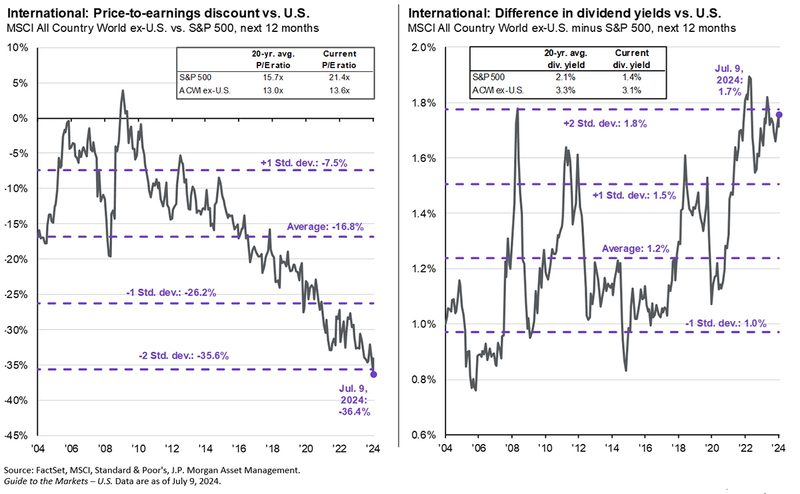
We believe that declining inflationary concerns over time, likely lower short-term interest rates in the second half of the year, and strong earnings projections for 2024 and 2025 will continue to benefit the stock market. Despite the recent drop in interest rates, bonds will likely be a positive contributor to overall performance should our forecast of lower inflation materialize.
Despite our positive outlook, the market does face risks as we start the third quarter. Slowing economic growth, disappointment if the Fed doesn’t cut rates in September, underwhelming Q2 earnings results, a rebound in inflation and geopolitical surprises are all potential negatives. Also, given high levels of investor optimism, any of those events could cause a pullback in markets.
While any of those risks (either by themselves or in combination with one another) could result in a drop in stocks or bond prices, the risk of slowing economic growth is perhaps the most substantial threat to this 2024 rally. To that point, for the first time in years, economic data is pointing to a clear loss of economic momentum. So far, the market has welcomed that moderation in growth because it has increased the chances of a September rate cut. However, if growth begins to slow more than expected and concerns about an economic contraction increase, that would be a new, material negative for markets.
*The statistical data represented in "The Key Events of the Quarter" section above is sourced from the Sevens Report Q2 2024 Quarterly Letter
