Since the Federal Reserve began raising interest rates in March of 2022, there has been a pitched battle of “chicken” between the Fed and the average consumer. The Fed began raising rates about a year after inflation started a dramatic climb to its highest level in some 41 years. Those rate hikes have amounted to five percentage points on the Fed's benchmark to a level not seen since 2007. As a result, all sorts of loans tied to short-term interest rates have skyrocketed. These include credit card rates, home equity lines of credit, car loans, personal loans, and business loans.
The Fed has done its best to force higher borrowing rates on individuals and corporations in the hope that meaningful layoffs will follow, thus driving inflation down over time by lessening demand for products and services. What the Fed did not count on was the resilience of the U.S. consumer, who is experiencing solid wage growth and continues to spend on travel and dining out. Learn more about 2Q2023 and what may be ahead in remainder of 2023.
Part 1: Looking back at Q2 2023
Part 2: What actions did we take in McKinley Carter portfolios last quarter?
Part 3: A look ahead - our outlook for the rest of 2023
Looking back at Q2 2023
Since the Federal Reserve began raising interest rates in March of 2022, there has been a pitched battle of “chicken” between the Fed and the average consumer. The Fed began raising rates about a year after inflation started a dramatic climb to its highest level in some 41 years. Those rate hikes have amounted to five percentage points on the Fed's benchmark to a level not seen since 2007. As a result, all sorts of loans tied to short-term interest rates have skyrocketed. These include credit card rates, home equity lines of credit, car loans, personal loans, and business loans.
The Fed has done its best to force higher borrowing rates on individuals and corporations in the hope that meaningful layoffs will follow, thus driving inflation down over time by lessening demand for products and services. What the Fed did not count on was the resilience of the U.S. consumer, who is experiencing solid wage growth and continues to spend on travel and dining out.
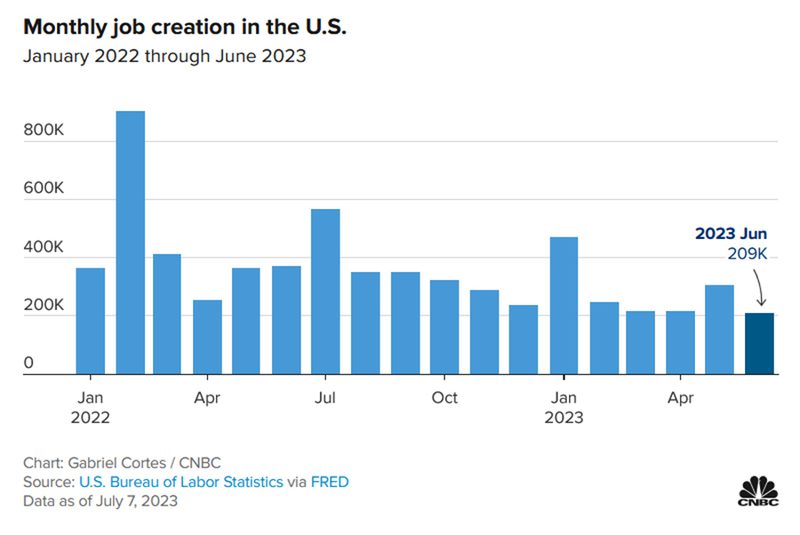
In addition, corporations are only grudgingly laying off workers due to an ongoing labor shortage in this country. The jobs report for June showed a slowing, but still expanding workforce and a modest 3.6% unemployment rate.
In our first quarter report entitled, “Moving the Goal Posts – When Will it Stop?” we highlighted that after one of the most intense interest rate hiking campaigns in history, the Federal Reserve was likely nearing an end to the increases and that action would remove a material headwind on the economy. We also indicated that, while stock valuations were certainly not cheap in April, declining inflation data should lead to lower interest rates over time which, in turn, should likely lead to expanding price/earnings (PE) multiples and higher stock prices. While interest rates did not decline in the second quarter, inflation data did improve, and stock prices rallied sharply.
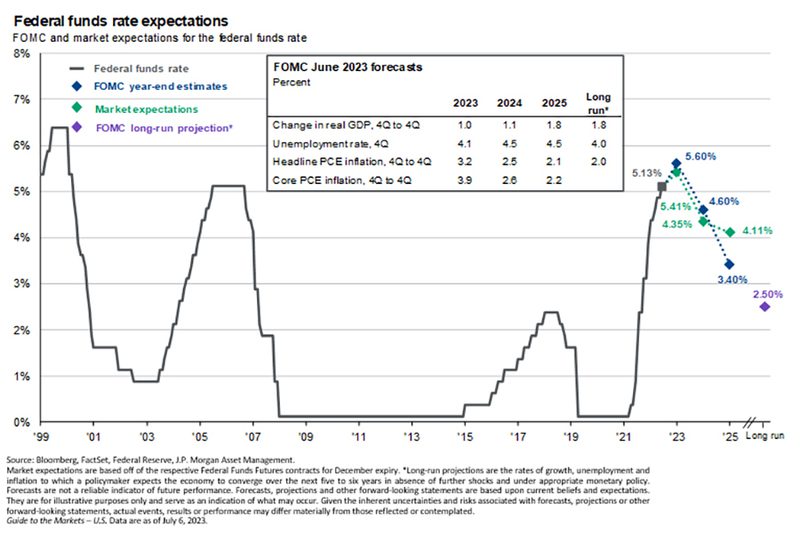
After the Fed raised the Federal Funds rate for the tenth consecutive time in early May to level of 5.0% to 5.25%, they chose not to raise rates at the June meeting as the committee indicated their desire to assess the economic impact of previous increases.
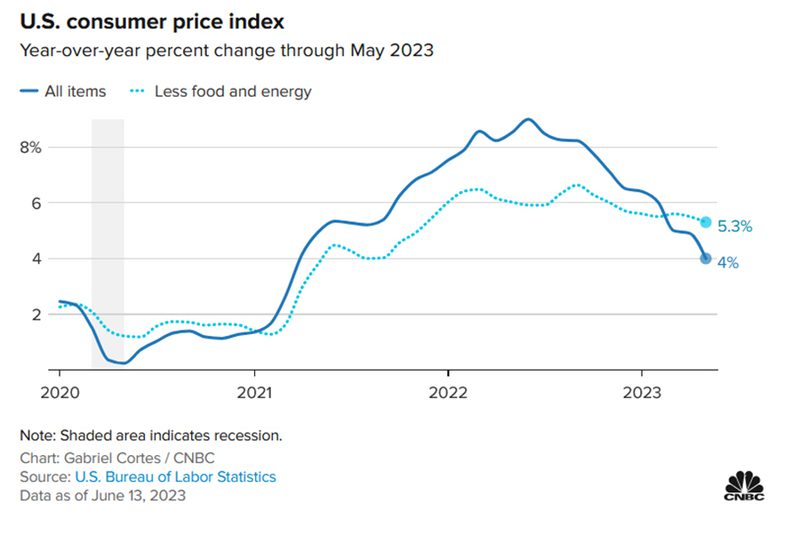
Annual headline inflation as shown in the Consumer Price Index dropped to 4% in May, the eleventh straight month of decline, and the lowest since March of 2021.
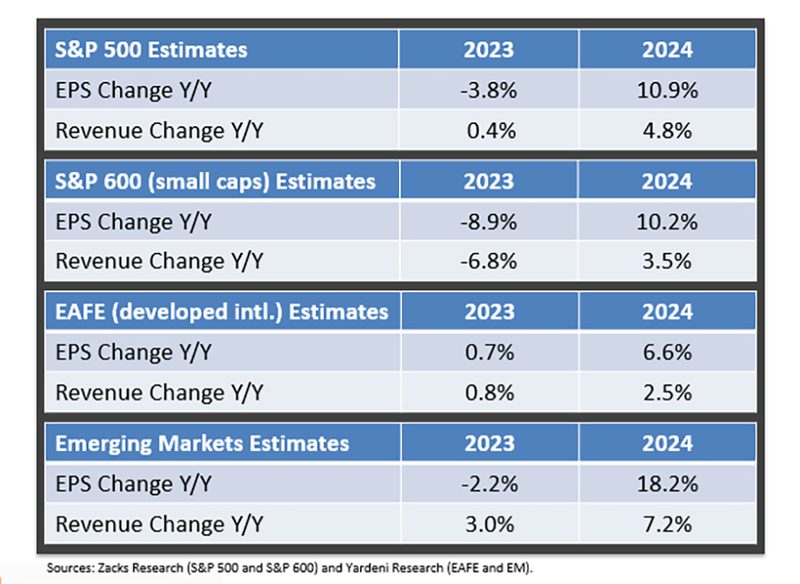
Additionally, we pointed out in our first quarter report that while earnings estimates have steadily declined this year, the projections for next year (a key driver of future stock prices) remain robust for both domestic and international stocks.
The S&P 500, led by huge gains in select large technology-related companies, enjoyed a strong second quarter. The vast majority of the gains in the index were driven by the robust performance of seven companies, affectionately called “The Magnificent Seven.” These top performers were well known names Apple, Amazon, Microsoft, Nvidia, Meta (Facebook), Tesla, and Alphabet (Google). Investors piled into these stocks as they were perceived as “safe havens” from the uncertainty of overall corporate earnings. In addition, the stock market was helped by the resolution of the debt ceiling debate which removed a significant hurdle for economic growth and stability. The S&P 500 ended the second quarter and first half of 2023 at a 14-month high and most major stock indices logged solid gains in the second quarter following the pause in the Fed’s rate hike campaign and stronger-than-expected corporate earnings.
The Key Events of the Quarter
The second quarter began with markets still in the throes of the regional bank crisis following the March failures of Silicon Valley Bank and Signature Bank, and investors started the month of April wary of contagion risks. Those concerns proved mostly overdone, however, as throughout most of the month regional banks were stable. That stability allowed investors to re-focus on corporate earnings, and the results were much better than feared as 78% of S&P 500 companies reported better-than-expected Q1 earnings, a number solidly above the 66% long-term average. Additionally, 75% of reporting companies beat revenue estimates for the first quarter, also well above the long-term average. That solid corporate performance was a welcome sight for investors and coupled with general macroeconomic calm, allowed stocks to drift steadily higher throughout most of April. However, following an underwhelming earnings report, concerns about the solvency of First Republic Bank weighed on markets late in the month and the S&P 500 declined into the end of April to finish with a modest gain.
Fears of a First Republic Bank failure were realized on May 1st, as the bank was seized by regulators and the FDIC was appointed its receiver. However, that same day, JPMorgan announced it was acquiring the bank from the FDIC, and that move helped to calm investor anxiety about financial contagion risks. The Federal Reserve also helped to distract investors from the First Republic failure, as the Fed hiked rates at the May 2nd FOMC meeting, but importantly altered language in the statement to imply it would pause rate hikes at the next meeting. That change was expected by investors, however, and as such it failed to ignite a meaningful rally in stocks. Instead, the tech sector helped push the S&P 500 higher in mid-May, thanks to an explosion of investor and financial media enthusiasm around Artificial Intelligence (AI), which was highlighted by a massive rally in Nvidia (NVDA) following a strong earnings report. However, like in April, the end of the month saw an increase in volatility. This time it was thanks to the lack of progress on a U.S. debt ceiling extension and rising fears of a debt ceiling breach and possible U.S. debt default. However, a two-year debt ceiling extension was agreed to by Speaker McCarthy and President Biden on May 28th and was signed into law a few days later, avoiding a financial calamity. The S&P 500 finished May with a slight gain.
With the debt ceiling resolved, a Fed pause in rate hikes expected and continued stability in regional banks, the rally in stocks resumed in early June and was aided by several potentially positive developments. First, inflation declined as the Consumer Price Index (CPI) hit the lowest level in two years. Second, economic data remained impressively resilient, reducing fears of a near-term recession. Finally, in mid-June, the Federal Reserve confirmed market expectations by pausing rate hikes and that helped fuel a broad rally in stocks that saw the S&P 500 move through 4,400 and hit the highest levels since April 2022. The last two weeks of the month saw some consolidation of that rally thanks to mixed economic data, political turmoil in Russia and hawkish rhetoric from global central bankers, but the S&P 500 still finished June with strong gains.
In sum, markets were impressively resilient in the second quarter and throughout the first half of 2023, as better-than-feared earnings, expectations for less-aggressive central bank rate hikes, more evidence of a “soft” economic landing and relative stability in the regional banks pushed the S&P 500 to a 14-month high.
Second Quarter Performance Review
The second quarter of 2023 saw an acceleration of the tech sector outperformance witnessed in the first quarter, as “AI” enthusiasm drove several mega-cap tech stocks sharply higher. Those strong gains resulted in large rallies in the tech-focused Nasdaq and, to a lesser extent, the S&P 500 as the tech sector is the largest weighted sector in that index. Also like in the first quarter, the less-tech-focused Russell 2000 and Dow Industrials logged more modest, but still solidly positive, quarterly returns.
- By market capitalization, large caps outperformed small caps, as they did in the first quarter of 2023. Regional bank concerns and higher interest rates still weighed on small caps as smaller companies are historically more dependent on financing to maintain operations and fuel growth.
- From an investment style standpoint, growth handily outperformed value again in the second quarter, continuing the sharp reversal from 2022. Tech-heavy growth funds benefited from the “AI” enthusiasm. Value funds, which have larger weightings towards financials and industrials, relatively underperformed growth funds, as the performance of non-tech sectors more reflected the broad economic reality of mostly stable, but unspectacular, economic growth.
- On a sector level, eight of the 11 S&P 500 sectors finished the second quarter with positive returns. As was the case in the first quarter, the Consumer Discretionary, Technology, and Communication Services sectors were the best performers for the quarter. The surge in many mega-cap tech stocks such as Amazon (AMZN), Apple (AAPL), Alphabet (GOOGL), Meta Platforms (META), and Nvidia (NVDA) drove the gains in those three sectors, and they handily outperformed the remaining eight S&P 500 sectors. Industrials, Financials, and Materials saw moderate gains over the past three months, thanks to rising optimism regarding a “soft” economic landing.
- Turning to the laggards, traditional defensive sectors such as Consumer Staples and Utilities declined slightly over the past three months, as resilient economic data caused investors to rotate to sectors that would benefit from stronger than expected economic growth. Energy also posted a slightly negative return for the second quarter, thanks to weakness in oil prices.
- Turning to the laggards, traditional defensive sectors such as Consumer Staples and Utilities declined slightly over the past three months, as resilient economic data caused investors to rotate to sectors that would benefit from stronger than expected economic growth. Energy also posted a slightly negative return for the second quarter, thanks to weakness in oil prices.
- Internationally, foreign markets lagged the S&P 500 thanks mostly to the relative lack of large-cap “AI” exposed stocks in major foreign indices, combined with some late-quarter worries about the EU economy and pace of Bank of England rate hikes, although foreign markets did finish the second quarter with a modestly positive return. Foreign developed markets outperformed emerging markets thanks to a lack of significant economic stimulus in China, which weighed on emerging markets late in the quarter.
- Commodities saw modest losses in the second quarter as most major commodities declined over the past three months. Oil prices witnessed a moderate drop despite a surprise production cut from Saudi Arabia and an increase in geopolitical tensions in Russia, as concerns about future economic growth and oversupply weighed on oil. Gold, meanwhile, posted a modestly negative return as inflation declined while the dollar failed to meaningfully drop.
- Switching to fixed income markets, the leading benchmark for bonds (Bloomberg US Aggregate Bond Index) realized a slightly negative return for the second quarter of 2023, as the resilient economy and hope of a near-term end to Fed rate hikes led investors to embrace riskier assets.
- Looking deeper into the fixed income markets, shorter-duration bonds outperformed those with longer durations in the second quarter, as bond investors priced in a near-term end to the Fed’s rate hike campaign, while optimism regarding economic growth caused investors to rotate out of the safety of longer-dated fixed income. McKinley Carter’s bond portfolios have maintained a shorter-than-benchmark duration throughout the year, allowing our fixed income allocation to outperform the index.
- Turning to the corporate bond market, lower-quality, but higher-yielding “junk” bonds rose modestly in the second quarter while higher-rated, investment-grade debt logged only a slight gain. That performance gap reflected investor optimism on the economy, which led to taking more risk in exchange for a higher return.
| U.S. Equity Indexes | Q2 Return | YTD |
|---|---|---|
| S&P 500 | 10.32% | 16.89% |
| DJ Industrial Average | 5.28% | 4.94% |
| NASDAQ 100 | 17.33% | 39.35% |
| S&P MidCap 400 | 6.70% | 8.84% |
Source: YCharts
| International Equity Indexes | Q2 Return | YTD |
|---|---|---|
| MSCI EAFE TR USD (Foreign Developed) | 3.63% | 12.13% |
| MSCI EM TR USD (Emerging Markets) | 1.50% | 5.10% |
| MSCI ACWI Ex USA TR USD (Foreign Dev & EM) | 3.13% | 9.86% |
Source: YCharts
| Commodity Indexes | Q2 Return | YTD |
|---|---|---|
| S&P GSCI (Broad-Based Commodities) | -1.45% | -7.54% |
| S&P GSCI Crude Oil | -5.21% | -12.40% |
| GLD Gold Price | -3.08% | 5.23% |
Source: YCharts/Koyfin.com
| U.S. Bond Indexes | Q2 Return | YTD |
|---|---|---|
| Bloomberg US Agg Bond | -0.38% | 2.09% |
| Bloomberg US T-Bill 1-3 Mon | 1.23% | 2.33% |
| ICE US T-Bond 7-10 Year | -1.32% | 1.62% |
| Bloomberg US MBS (Mortgage-backed) | -0.41% | 1.87% |
| Bloomberg Municipal | 0.04% | 2.67% |
| Bloomberg US Corporate Invest Grade | 0.40% | 3.21% |
| Bloomberg US Corporate High Yield | 2.60% | 5.38% |
Source: YCharts
What actions did we take in McKinley Carter portfolios last quarter?
- Added to iShares S&P 500 Value ETF (IVE) in ActiveTrack (AT) models to increase large cap allocation.
- Removed iShares Morningstar Mid-Cap Growth ETF (IMCG) from AT models and reduced positions in iShares Russell Top 200 ETF (IWL) and Dimensional US Targeted Value ETF (DFAT) in AT models to reduce mid cap and small cap allocations and to reduce growth stock allocation due to sharp outperformance from growth in 2023.
- Approved a non-BlackRock StrategicFocus (SF) model for those clients who would like an alternative to BlackRock strategies.
- Eliminated Tesla (TSLA), Centene (CNC), Estee Lauder (EL), and Qualcomm (QCOM) from EarningsFocus and Hybrid models and replaced with Adobe (ADBE), Novo Nordisk (NVO), McKesson (MCK), and Monster Beverage (MNST) due to better earnings stability scoring.
- Removed Pacer US Cash Cows 100 ETF (COWZ) from the Tacticals sleeve model due to its overweighting in energy stocks. Split COWZ evenly into Financial Select Sector SPDR® ETF (XLF) and Health Care Select Sector SPDR® ETF (XLV).
- Removed Invesco NASDAQ Next Gen 100 ETF (QQQJ) from the Tacticals sleeve model and replaced it with Technology Select Sector SPDR® ETF (XLK) to add more large cap tech stocks.
- Replaced iShares JP Morgan USD Emerging Mkts Bd ETF (EMB) for JPMorgan USD Emerging Mkts Sovereign Bd ETF (JPMB) in SF due to poor scoring and took iShares International Select Div ETF (IDV) from 17% of the DividendFocus model portfolio to 12% and added 5% Vanguard Intl Div Appreciation ETF (VIGI) in order to add greater exposure to the dividend growth factor.
A look ahead - our outlook for the rest of 2023
As we begin the third quarter of 2023, the twelve-month outlook for stocks and bonds is quite positive, as inflation hit a two-year low, economic growth and the labor market remain impressively resilient, the Fed has temporarily paused its historic rate hiking campaign and interest rates are likely nearing a peak. Additionally, the debt ceiling extension was resolved, we’ve seen no significant contagion from the regional bank failures from earlier this year, and earnings projections for 2024 are robust.
That improvement in the fundamental outlook has been reflected in both stock and bond prices so far this year, as the S&P 500 hit the best levels since last April and more cyclically focused sectors led markets higher late in the quarter on rising hopes for a broad economic expansion.
As we have previously stated, many inflation indicators such as the Global Supply Chain Pressure Index, inflation expectations surveys, and commodity prices peaked last year and are headed lower, giving the Federal Reserve fewer reasons to raise short-term interest rates from this point. That said, the Fed’s policymakers indicated that they envision potentially two more interest rate hikes this year due to high wages and spending on services — a more hawkish forecast than had been expected. And even after the Fed has stopped hiking, it’s likely to keep borrowing rates at a peak for months to come. As a result, consumers will still have to bear the weight of higher-cost auto loans, mortgages, credit cards and other forms of borrowing.
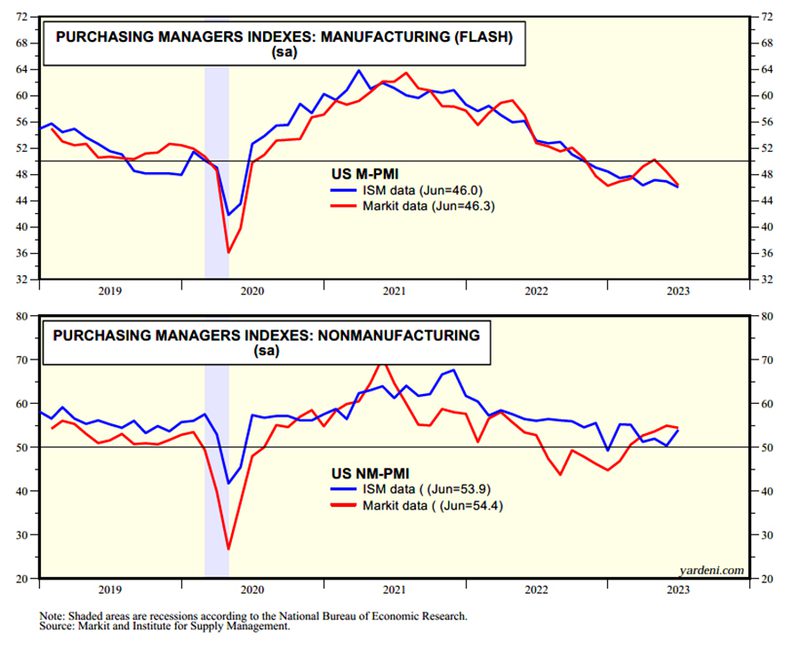
As we look at the overall economy, while manufacturing remains in contraction (<50), services (nonmanufacturing in the chart below) remain the backbone of current economic growth as consumers are vacationing and dining out in large numbers. Unemployment continues to be low and is still supportive of consumer spending on services.
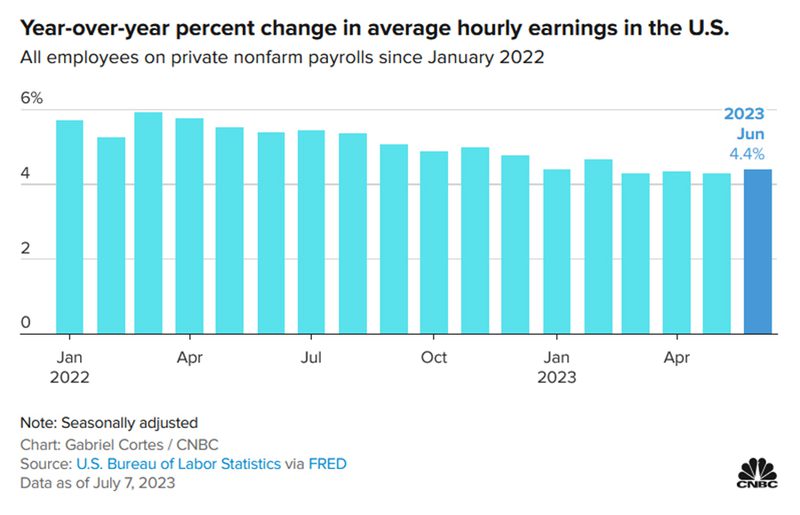
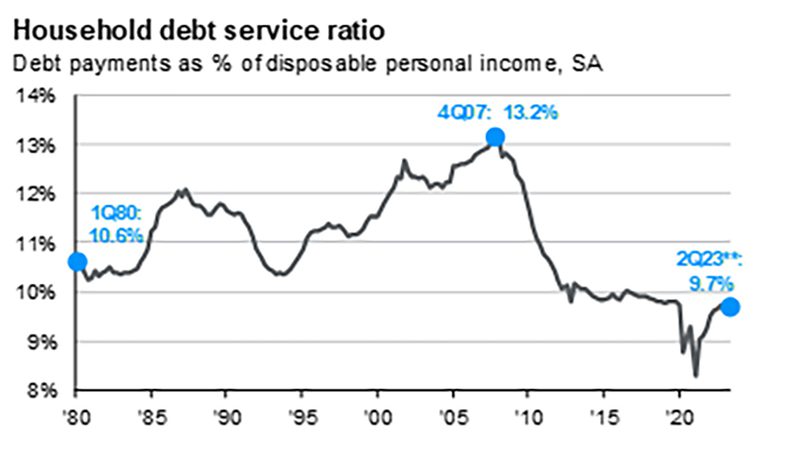
Despite rising credit card usage, total consumer debt is still reasonable as a percentage of disposable personal income, and wage growth of 4.4% now exceeds headline inflation (4%).
As the stock market’s gains this year do present some near-term valuation headwinds for U.S. stocks, we believe that the third quarter performance may be a bit choppy. Should the analysts’ earnings projections be lowered due to more evidence of downward economic pressure because of additional banking concerns and rising unemployment, the stock market may give back some of 2023’s impressive gains. Investor optimism, as measured by the AAII Sentiment Survey on July 5th, is currently at a one-year high and presents a short-term challenge to equity prices.
Also, while there’s clearly been progress in bringing inflation down, as year-over-year CPI has fallen from over 9% in 2022 to 4% in less than a year’s time, CPI remains far above the Fed’s 2% target. If inflation bounces back, or fails to continue to decline, then the Fed could easily hike rates further and upset financial markets.
On an additional cautionary note, the economy has not yet felt the full impact of the Fed’s historically aggressive hike campaign, and while the economy has proved surprisingly resilient so far, we know from history that the impacts of rate hikes can take far longer than most expect to impact economic growth. It’s premature to think the economy is “in the clear” from recession risks, and we should expect the economy to slow more as we move into the second half of 2023. The key for markets will be the intensity of that slowing, as at these valuation levels stocks are not pricing in a significant economic slowdown.
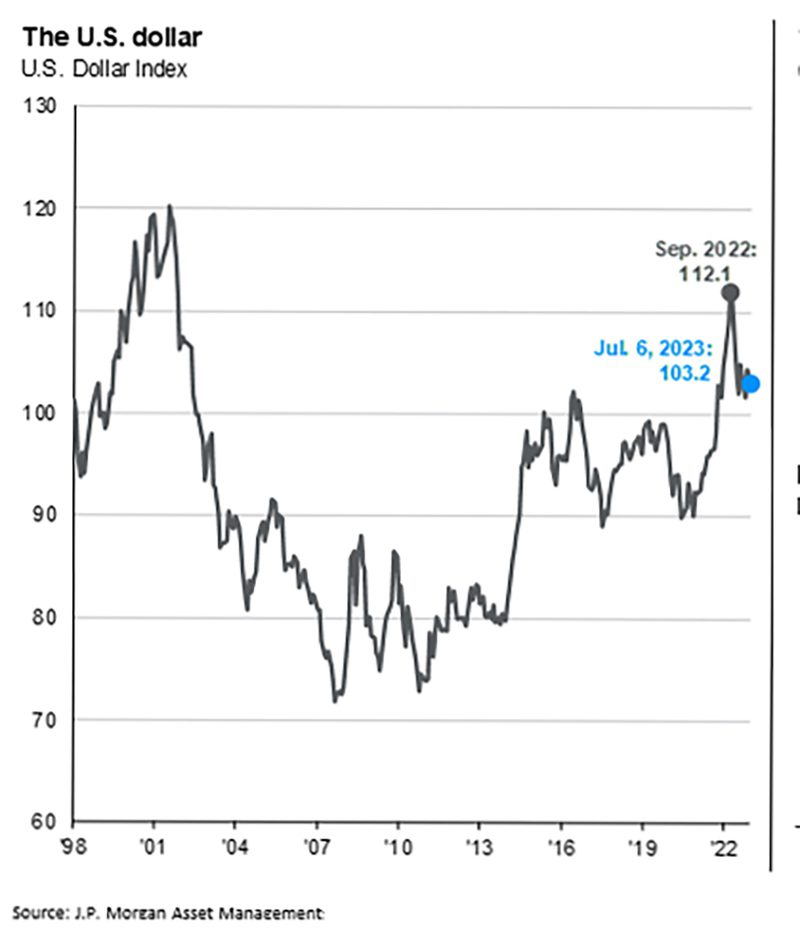
However, over the next year, stocks will likely continue to outperform bonds as inflation continues to subside, the Federal Reserve stops raising interest rates, and the stock market anticipates an earnings recovery in 2024. A declining U.S. dollar coinciding with peaking interest rates should benefit international stocks, which had been previously hurt by a strong dollar.
In sum, despite some current headwinds, we feel that both the stock and bond markets can provide good returns in the second half of 2023 as inflation pressures likely ease further, interest rates peak soon, and the economy avoids a significant recession as consumer spending is bolstered by low unemployment, strong wage growth, and U.S. households’ net worth near record highs.
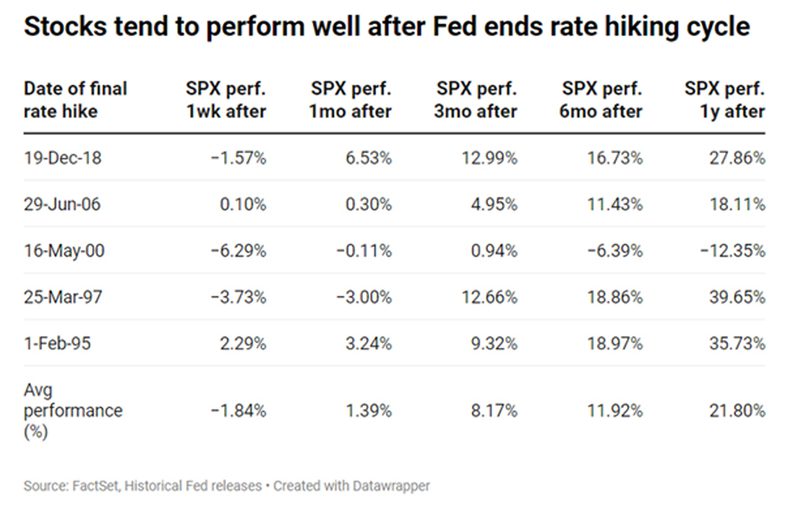
On a final and important note, history shows that stocks usually perform very well beginning shortly after a Fed hiking cycle concludes.
