Note: This information is from 2020 but much has changed since then. Please be sure to discuss your unique financial situation with your McKinley Carter Advisor or another trusted professional.

2020 continues to be one of the most unpredictable years in memory, as markets rose to new all-time highs in the third quarter despite a resurgence in coronavirus cases, as stocks rallied thanks to a combination of an even more accommodative Fed policy, hopes for a COVID-19 vaccine, and a stronger-than-expected economic rebound, before markets declined moderately from those highs in mid-September.
2020 continues to be one of the most unpredictable years in memory, as markets rose to new all-time highs in the third quarter despite a resurgence in coronavirus cases, as stocks rallied thanks to a combination of an even more accommodative Fed policy, hopes for a COVID-19 vaccine, and a stronger-than-expected economic rebound, before markets declined moderately from those highs in mid-September.
As we move into the fourth quarter, I am reminded of a movie quote from the 1950 movie, All About Eve, where Margo Channing, a highly regarded but aging Broadway star played by actress Bette Davis, uttered the well-known quote, “Fasten your seat belts, it’s going to be a bumpy night.” While this has often been misquoted using the phrase “bumpy ride,” the sentiment is the same.
Indeed, the market’s dramatic rebound from the lows experienced in March of this year (seen below in the chart of the S&P 500 Index) has, at first blush, the appearance of a highly regarded but aging equity market snap back that surely must have fully discounted all the possible good news of a future COVID-19 vaccine and the subsequent “return to normal.” While this perception certainly has some merit in terms of the lofty expectations built into economic and earnings assumptions going forward, massive monetary support by the Federal Reserve, as well as historic fiscal stimulus by the Congress, has provided a safety net for the equity markets that is helping to cushion against a potential “bumpy night” scenario.
S&P 500:

The Federal Reserve
As a reminder of the critical role they have played in the recovery thus far, we must go back to the actions taken by the Fed in March in response to the coronavirus and its impact on the U.S. economy:
March 15 – The Fed Funds Rate Cut to Zero
The federal funds rate, used as a benchmark for short-term lending and the rate to which most consumer rates are pegged, serves as a stand-in for interest rates for the American economy. Despite considerable pressure, the Fed had been reluctant to lower the federal funds rate over the past two years, eventually lowering the rate from 2.25% to 2% in August 2019, with further minor cuts in September and October. Despite dropping the rate 50 basis points (0.50%) on March 3, this was evidently not enough, and on Sunday, March 16, the Fed took the dramatic step to lower the federal funds rate to 0%.
March 15 – Quantitative Easing
In addition to cutting the federal funds rate to zero, the Fed also announced a new round of QE, a controversial tool for boosting the economy last employed in any significant way as a result of the 2007 – 2008 financial crisis. Quantitative easing, also known as large scale asset purchases, typically involves a central bank itself purchasing government bonds or other long-term securities in order to restore confidence and, crucially, add liquidity back into the market. The Fed announced that it would commence the QE program with an immediate $80 billion buy but would purchase “at least” $700 billion in assets over the coming months with no limit.
March 23 – Bond Buying
The central bank's announcement of new intervention marked a turning point for financial markets. The Fed's move into corporate credit markets (buying corporate bonds) set a backstop for risk assets and drove investors back to highly volatile markets after weeks of severe selloffs. It is no coincidence that March 23rd was the date that marked the end of the of the stock market’s decline.
The bold steps by the Federal Reserve, along with an unprecedented and timely response by the U.S. Congress to pass the Coronavirus Aid, Relief, and Economic Security Act, also known as the CARES Act (a $2.2 trillion economic stimulus bill passed by the Congress and signed into law on March 27), served as the foundation on which the U.S. economy began to rebuild. These actions, along with American ingenuity in the fields of healthcare and technology have brought us to the point where markets are reflecting a high confidence level in a dramatic recovery in economic growth for the third quarter of 2020 and beyond.
The Economy
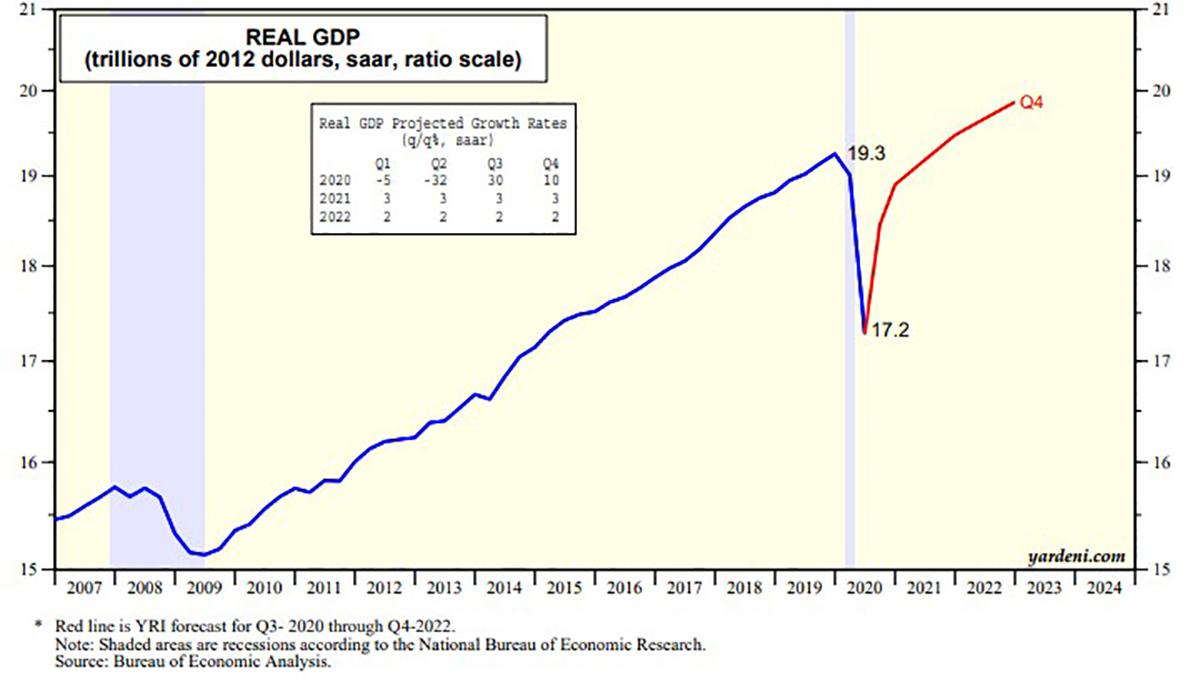
COVID lockdowns crushed the economy in the first half of 2020, with real GDP down 5.0% at an annual rate in the first quarter and 32.0% at annual rate in the second quarter, the latter of which was the steepest drop in real GDP for any quarter since the Great Depression in the 1930s.
But for the third quarter, the US is tracing out a V-shaped bounce and likely grew somewhere between 30 - 35% at an annual rate, the fastest increase in real GDP for any quarter since at least World War II. The rebound is due to two things...a shift in activity toward businesses that were able to stay open because they were "essential" or found new ways of getting things done, and the actual reopening of businesses in recent months. Still, because many types of businesses are regulated, and because some companies will probably never reopen, it looks like it will take until late 2021 for real GDP to fully get back to where it was pre-COVID-19. However, real GDP is expected to rebound to a minimum of 3% growth in 2021.
Economy-wide corporate profits peaked in the fourth quarter of 2019 but then fell 12% in Q1 and another 10.3% in Q2. Converting these figures into annualized changes, profits declined at a 37.6% rate in the first half of 2020, versus a total 2-quarter drop of 19.2% for real GDP. In other words, profits dropped faster than the overall economy. Expectations are for this process to go in reverse for the third quarter and beyond.
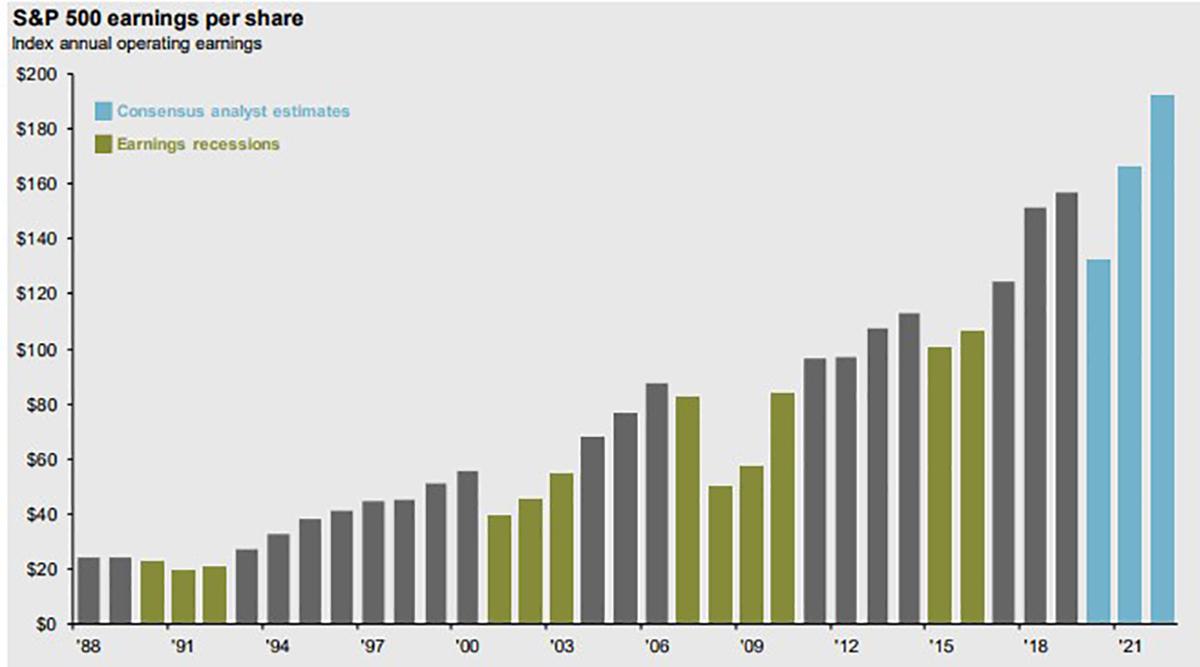
While there are numerous unknowns that can lead to a “bumpy night” scenario for the stock market in the fourth quarter, including the elections and their possible policy ramifications, to corporate earnings and the economy, the historically low interest rate environment and the extraordinary efforts of the health care community to develop therapeutics and vaccines for COVID-19 serve as catalysts for a sustained recovery in the economy as we look to 2021.
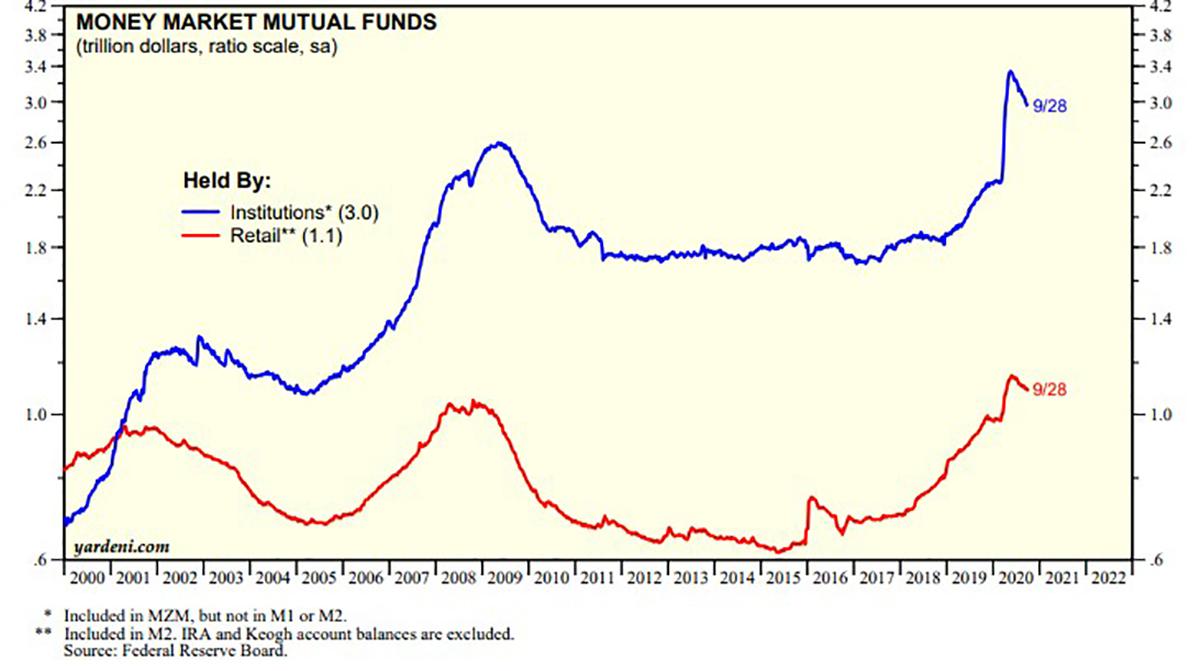
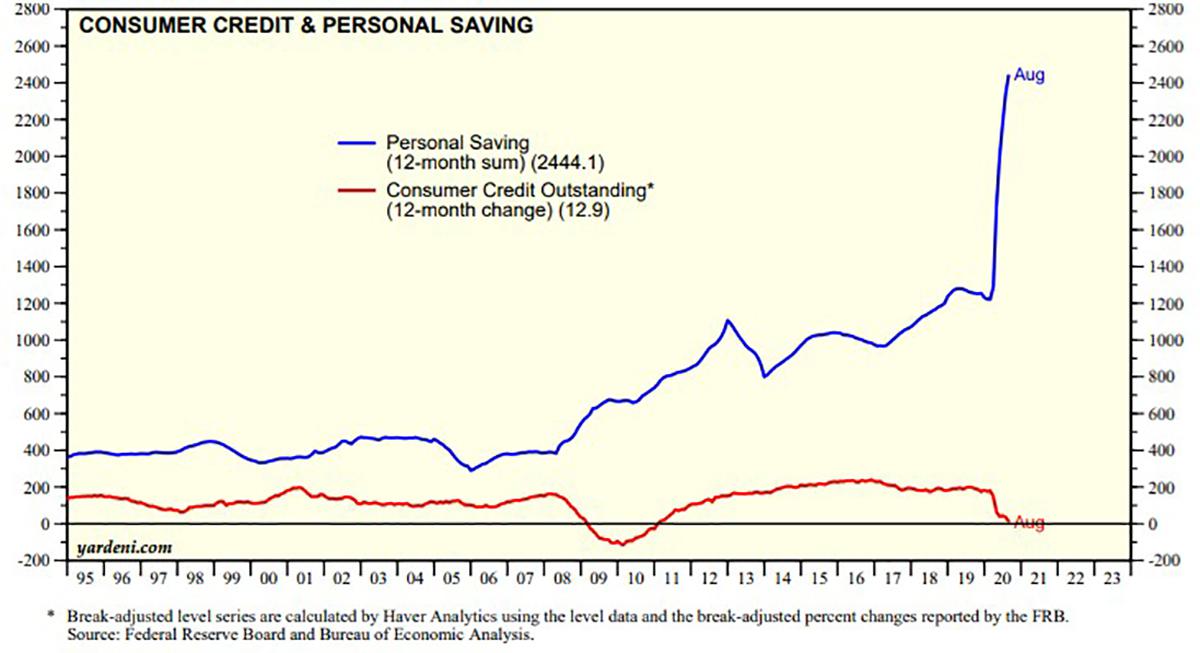
As American consumers have poured trillions of dollars into low-yielding (or 0% yielding) personal checking, savings, and money market accounts this year (see charts below) in response to economic uncertainty, these robust savings balances have served as “fuel” for equity market investments and the prospect of better returns. Investors have regained confidence in the economy as a result of the reopening of businesses and continued progress toward medical treatments that will lead to the inevitable post-COVID world. In addition, frugal use of credit this year has allowed consumers to be in a position to redeploy credit later as pent-up demand leads to future spending and stimulus to the economy.
Fourth Quarter Market Outlook
Looking forward, as we begin the final quarter of this historic year, the market correction of September helped to reset expectations about the numerous unknowns still facing investors in both the short and long-term. But while the September pullback was a reminder of potential market volatility, we started the final quarter of 2020 at more reasonable market valuations, historically speaking.
Despite the “bumpy night” that we have all experienced in our personal, professional, and economic lives this year, markets and the economy have staged a historic rebound since the late March lows. While we all welcome this impressive comeback, we enter the final quarter of the year keenly aware that some of the biggest unknowns for the markets and the economy will be resolved positively or negatively in the next three months. There could certainly be a lot of volatility between now and December 31st depending on 1) The elections, 2) Stimulus, 3) COVID case trends and a vaccine.
The Elections
Starting with the obvious, November 3rd is Election Day, and apropos for 2020 this election will be one of the most uncertain in our lifetimes. Beyond the most important question, “Who will win the Presidency?” markets are also focused on whether the Democrats will be able to take control of the Senate. If so, and Joe Biden wins the Presidency, Democrats would control both the legislative and executive branches of government, a scenario dubbed the “Blue Wave” by the financial media. Such a scenario would result in the increased potential for policy changes which would likely create short-term market volatility.
However, any near-term volatility associated with a Blue Wave would likely be small compared to the worst-case scenario for the election, namely that there is no clear winner by the end of Election Day and the election becomes contested which would result in the entire country being dragged through a similar episode of Bush vs. Gore in the early 2000s. If the overall race is tight, and if the vote count is close in key states on the night of the election, the delays could generate some uncertainty for the market until a winner is declared, potentially as late as mid-December. But we think the market is largely prepared for this as it is being well telegraphed.
Regardless of who is elected president, and which party controls the House and the Senate—and importantly, regardless of whether there is post-Election Day drama—we see scope for at least moderate U.S. economic and earnings growth, and therefore higher stock prices, in the next 12 months.
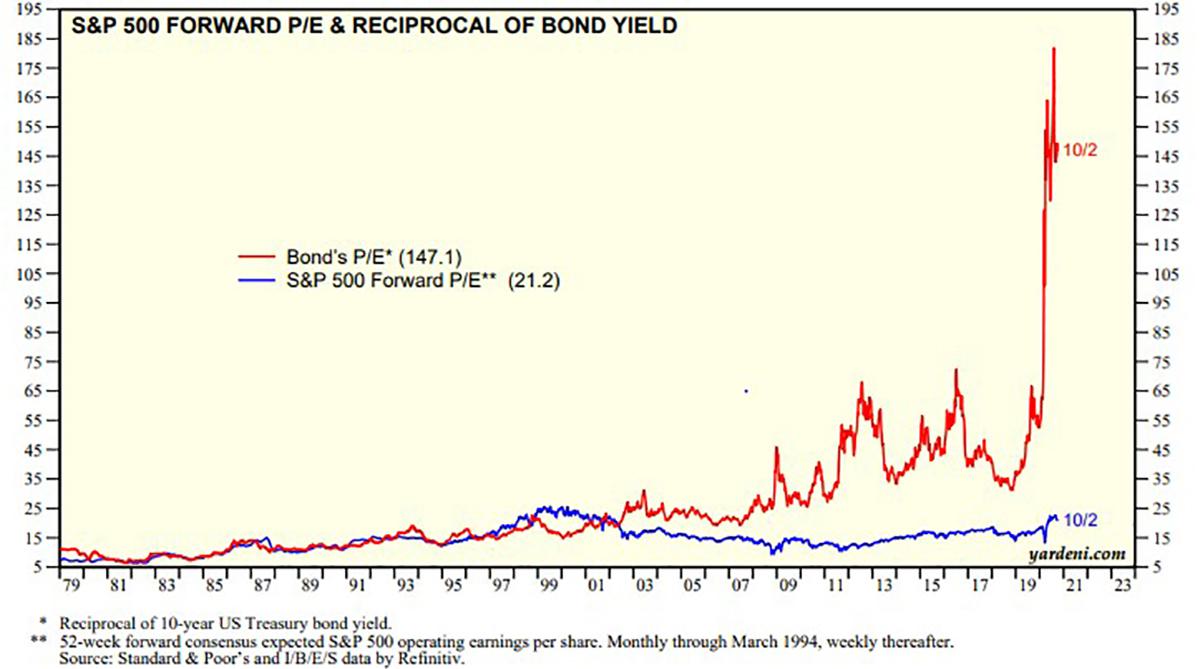
The election results will certainly have a short-term impact on the markets in the 4th quarter even as they are unlikely to offset the powerful influence of monetary policy and demographics over time. Also, the historically low interest rate environment has made bonds extremely expensive when compared to the stock market as the Price/Earnings (PE) ratio of the bond market is currently 147X compared to an S&P 500 PE ratio of 21X.
But isn’t this election a closely contested binary choice between too starkly different world views and economic philosophies, complicated by fears about election integrity and a delayed outcome?
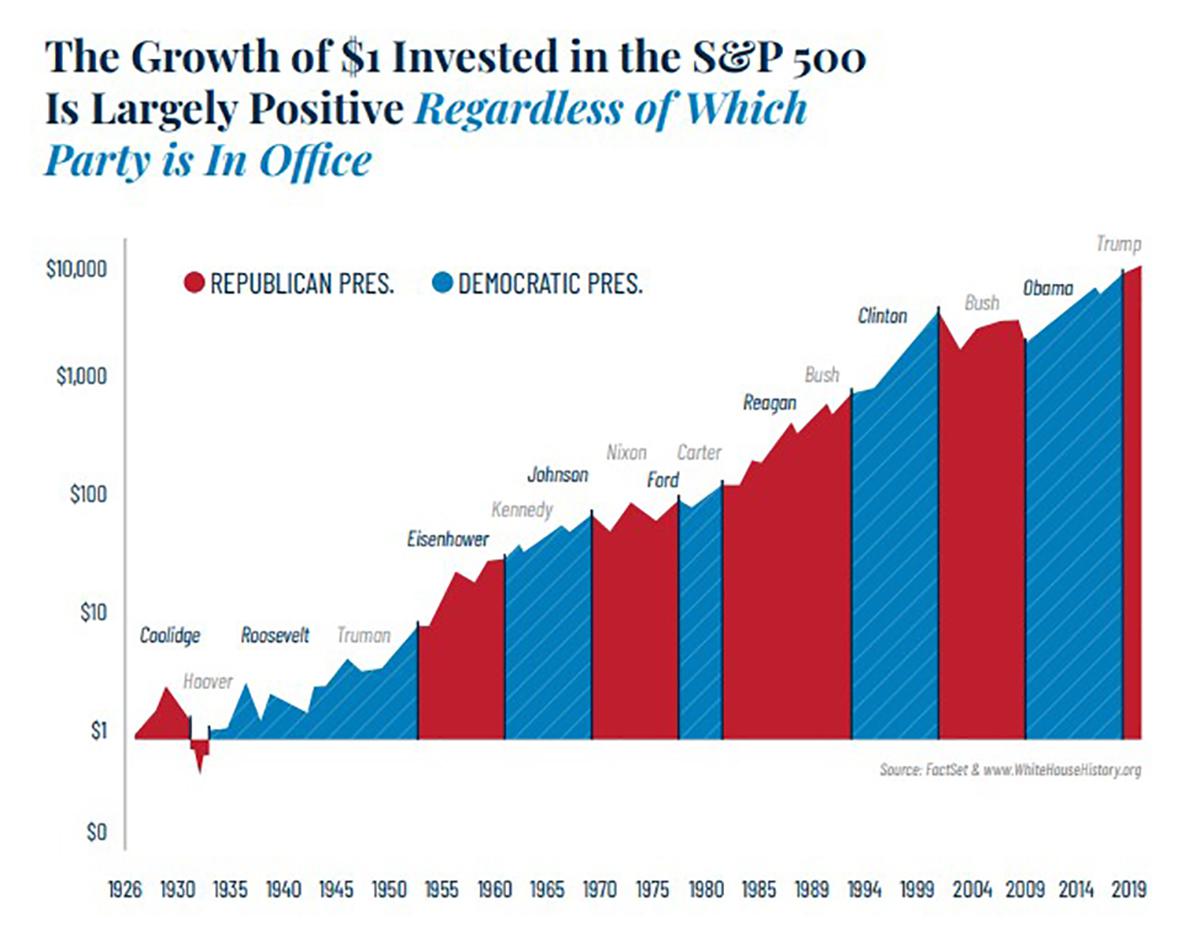
Yes. But one reason to believe the election is overplayed as a decisive and exploitable market swing factor is that investors always overplay elections – and they rarely prove to be instrumental inflection points for economic or market cycles. Witness the poor performance of energy stocks over the past four years despite a significant reduction of regulatory overhangs.
In order to treat an election as a specific catalyst for investment moves, one would have to handicap the result, anticipate the makeup of Congress, intuit the key policy priorities, evaluate the likelihood of them becoming law, estimate their economic impact and then determine how much of this has already been priced into financial markets. Presidential election uncertainty generally has not produced lower equity returns historically.
Stimulus
Unfortunately, the election is not the only source of potential uncertainty and volatility coming in the next three months. By the end of the fourth quarter, investors will learn the fate of the stimulus bill currently stuck in Congress. There is near-universal agreement the economy could use more stimulus, but the politics of the election, combined with Republican and Democrat differences about how much money should be spent and where that money should go, have prevented stimulus from being passed and delivered to the U.S. economy.
Investors have been hoping for another stimulus package as the U.S. economy continues to suffer due to the pandemic. Jobs are slowly coming back in some sectors, but recently released economic data showed lower-wage jobs are not coming back as quickly, and the unemployment rate remains stubbornly high at just under 8%. Moreover, that figure does not reflect the decline in labor force participation - millions of people who are out of work have stopped looking for jobs, which means they are no longer counted in the official unemployment figure. Markets expect a stimulus bill to pass by year-end, and if that fails to materialize, it will create more volatility.
The Recovery is Underway
Fortunately, there is clear evidence that the economy is repairing itself so the lack of a short-term stimulus bill may not derail the recovery:
1) Consumer-led V-shaped recovery
The October 2 update of the Atlanta Fed’s GDPNow model showed that Q3’s real GDP is tracking at a record jump of 35% following the record 32% drop during Q2. Leading the way up during Q3 is a 36.8% projected rebound in real consumer spending, following the 33.2% drop during Q2. In current dollars, personal consumption expenditures have rebounded 18.6% from April through August. It is only 3.4% below its record high during January. Interestingly, consumer spending on goods is up 24.0% over this period to a new record high. Spending on services is up 16.1% since April but still 7.4% below its record high during February. Although the recovery from May through September has been V-shaped, there are plenty of challenges ahead. The pace of the recovery is bound to slow in 2021, and there could be setbacks. However, so far, the recovery has been impressive.
2) A pile of savings to spend
How can it be that consumer spending has rebounded so strongly when millions of workers remain unemployed? During the lockdown recession, personal saving soared from $1.4 trillion during February to an all-time record of $6.4 trillion in April. It was back down to $2.4 trillion during August. Consumer spending clearly was boosted by the jump in the government social benefits component of personal income from $3.2 trillion during February to a record $6.6 trillion during April. However, government social benefits were down to $4.1 trillion during August. That is still well above the $3.2 trillion during February.
3) Earned income is rebounding
But don’t we need another round of fiscal stimulus to keep the consumer recovery going until a vaccine is available? Not if wages and salaries continue to rebound along with employment. The former is up 7.6% since April through August, while the latter is up 6.5% from April through September.
4) Housing-related spending is leading the way
The latest personal income release confirms the view that a housing-related spending boom is underway as a result of de-urbanization and record-low mortgage rates. Spending on furniture & furnishings and household appliances soared 38.9% from April through August to new record highs since June of this year. The recent jumps in new and existing home sales suggest that both categories of residential construction should be rising to new cyclical highs soon and could be on their way to record highs in coming months. Altogether, housing-related consumer and construction spending totaled a record-high $906.4 billion during August, surpassing the previous record high during February 2006 by 1.3%.
5) Spending on autos is also strong
Undoubtedly, the pandemic also has boosted the demand for autos along with the demand for houses by people moving out of cities to the suburbs and rural areas. Current-dollar spending on new motor vehicles jumped 50.6% from April through August to the highest pace since July 2005. Spending on used cars is up 94.5% since April.
6) Services are on the mend too
The services economy also has been recovering but has a long way to go to regain all that was lost during the lockdown recession. That is because several important services-providing industries remain challenged by various voluntary and enforced social distancing restrictions. Initially, the pandemic caused spending on health care services to plunge 34.7% from February through April. Hospitals suspended elective procedures in anticipation of a huge influx of COVID patients. Since April through August, this category is up 43.5%, which is only 6.4% from its record high during February.
Also taking a big hit from the lockdowns was spending on food services, including restaurants. This category plunged 47.5% from February through April but rebounded 69.4% through August. It is still 11.2% below its record high during January. It is likely to struggle to climb higher in coming months as winter weather forces restaurants to halt outdoor dining and do the best they can with significant capacity limits on indoor dining.
Among the services-providing industries, the most challenged have been Air Transportation, Hotels & Motels, Gambling, Amusement Parks, Campgrounds, & Related Recreation.
COVID Case Trends and a Vaccine
Hopes for a COVID-19 vaccine have helped stocks rally to current levels, and there are now three separate vaccines undergoing final Phase III trials. Those trials will likely reach their conclusion in the coming weeks, perhaps before the election. If those trials fail to produce a viable vaccine candidate, that will also create volatility as markets are expecting widespread COVID-19 vaccine distribution by early to mid-2021.
In addition to vaccines, one cannot dismiss the important of therapeutics such as Remdesivir and the experimental antibody cocktail President Trump recently received from Regeneron Pharmaceuticals as examples of possible mitigators of the impact of COVID-19. Even in the absence of a clinically proven vaccine, effective therapeutics can be instrumental in the treatment of the coronavirus and progress toward fully reopening the economy.
Currently, with spikes in daily new COVID-19 cases in the U.S., Canada, and Europe, fully reopening the global economy is challenging. However, great progress is being seen in several Asian countries as they have not experienced the “second wave” of COVID cases that so concerns epidemiologists. Ultimately, the virus will run its course, whether through vaccines, effective therapeutics, or herd immunity. As the markets are discounting mechanisms of future events, stocks are now anticipating that conclusion.
Bottom Line
The resiliency of the U.S. economy and markets is both admirable and encouraging, as the economic and market recovery from the worst pandemic in 100 years has been nothing short of extraordinary. That rebound verifies the value of sticking to a well-constructed, diversified financial plan aimed at achieving long-term investment goals.
However, our experience has taught us not to be complacent simply because the market has been resilient. So, while we have all welcomed the strong market rebound in Q2 and Q3, the fact remains that a lot of important unknowns will be resolved in Q4, and because of that, there is the likelihood for more market volatility during the final three months of 2020.
Despite the market’s sharp advance this year, it has been led by large growth stocks primarily found in the tech sector such as Apple, Amazon, and Microsoft. More cyclical or “value” stocks have only recently begun to participate in the market’s advance. Small cap stocks, having suffered this year due to their greater sensitivity to the health of the economy, have recently begun to outperform their larger counterparts as investor optimism grows about the prospects for an economic rebound in 2021. This rotation within equity markets is a healthy sign of a broadening out in leadership and increases the likelihood of a sustainable market advance.
In addition to the attractive relative valuations of stocks vs. bonds that are trading near all-time low yields is the lark of investor bullishness as we enter the fourth quarter of 2020. Muted enthusiasm by investors allows for the possibility of a market advance on any good news related to the coronavirus, the economy, or the elections.
Third Quarter Recap
The third quarter began with a resurgence of coronavirus cases in the United States, as new daily cases of COVID-19 smashed through levels seen in March and April, eventually topping out at a record 78,871 new cases on July 24th. But unlike March and April, stocks did not decline following the spike in new cases, as state governments enacted more surgical economic shutdowns instead of the wholesale lockdowns that occurred in the first half of the year. That change in strategy, combined with the fact that hospitalization rates and mortality rates of COVID-19 remained far below March and April levels, helped the stock market look past the increase in cases, and the S&P 500 rose 5.51% in July.
The rally continued in August, aided by the peak and subsequent decline of coronavirus cases in some of the largest U.S. states (California, Florida, and Texas). Additionally, despite the expiration of the CARES Act stimulus, U.S. economic data continued to improve throughout August, powering stocks higher. Finally, in late August the Federal Reserve formally announced the adoption of an “average inflation target,” which effectively signaled the Fed would tolerate higher inflation in the economy more so than in recent history. That policy shift is a potentially longer-term bullish event for stocks as they are positively correlated to higher inflation. Led by gains in the tech sector, the S&P 500 hit a new all-time high in mid-August and the rally continued through month-end. The S&P 500 rose 7.01% in August and finished the month in solidly positive territory on a year-to-date basis.
The final month of the third quarter, however, provided a reminder that the macro-economic outlook remains uncertain and markets can still quickly become volatile. The tech rally in August was so relentless that it elicited comparisons by the financial media to the tech bubble of the 2000s. While that was somewhat hyperbolic, the pace of the gains in the tech sector simply was not sustainable. And in the first few days of September, the tech rally became exhausted, the Nasdaq peaked, and stocks began a correction process that would last for most of the month. From a catalyst standpoint, the initial declines were a function of buyer exhaustion, but there were also some incrementally negative events in September that weighed on stocks. First, it became evident that there would be no new economic stimulus bill in September, as both Democrats and Republicans remained far apart in negotiations. Second, economic data began to imply a “plateau” in the economic recovery. Finally, late in the month, coronavirus cases surged in Europe and began to move higher again in certain U.S. states, prompting some concern about a return to various levels of economic lockdown in Europe and the U.S. The S&P 500 declined modestly in September but remained solidly positive for the third quarter.
Q3 Market Performance Review: New All-Time Highs
U.S. Markets
The major U.S. stock indices all extended the rebound that began in the second quarter of 2020, and just like the previous two quarters, the tech-heavy Nasdaq outperformed the other major indices. Those gains were once-again driven by the performance of some of the largest, most-well-known tech companies in the world, as they are viewed as the longer-term beneficiaries of changing personal and professional behavior in response to the pandemic. Stocks such as Apple (AAPL), Amazon (AMZN), Google (GOOGL), and Netflix (NFLX) helped send the Nasdaq to new all-time highs in July, August, and early September.
By market capitalization, large-cap stocks outperformed small-cap stocks, a reversal from the second quarter. Large caps outperformed primarily because doubts remain about how quickly the U.S. economy will return to pre-COVID 19 levels, especially with the expiration of economic stimulus in late July. Since small caps are historically more sensitive to changes in broad economic growth, that uncertainty weighed on small-cap indices, although they still finished with a positive return for the quarter. From an investment style standpoint, growth outperformed value, yet again, because of strength in large-cap tech.
On a sector level, 10 of the 11 S&P 500 sectors finished with a positive return for the third quarter. As previously mentioned, tech outperformed, but so did consumer discretionary and materials sectors, as investors rotated into some of the hardest hit sectors in the market on the hope that coronavirus cases would continue to recede and people would venture back out into the economy, visiting malls and restaurants, and traveling sooner than previously expected.
Defensive sectors, those that are historically less sensitive to expected changes in the economy such as utilities, consumer staples, and healthcare, lagged the S&P 500 in the third quarter, although they all posted solidly positive quarterly returns. The only S&P 500 sector to finish with a negative return in the quarter was energy as investors continued to worry about future global demand in the context of still-elevated oil supplies.
| U.S. Equity Indexes | Q3 Return | YTD |
|---|---|---|
| S&P 500 | 8.93% | 5.57% |
| DJ Industrial Average | 8.22% | -0.91% |
| NASDAQ 100 | 12.62% | 31.65% |
| S&P MidCap 400 | 4.65% | -8.97% |
| Russell 2000 | 4.93% | -8.69% |
| Source: YCharts |
International
International markets rallied in the third quarter as European and Asian economies continued to re-open. But many foreign developed markets closed well off the highs of the quarter as coronavirus cases spiked in parts of Europe, particularly in Great Britain. Emerging markets outperformed foreign developed markets thanks to a continued decline in the U.S. dollar paired with strength in Asian markets, as the coronavirus outbreak remains broadly contained in that region of the world.
| International Equity Indexes | Q3 Return | YTD |
|---|---|---|
| MSCI EAFE TR USD (Foreign Developed) | 4.88% | -6.73% |
| MSCI EM TR USD (Emerging Markets) | 9.70% | -0.91% |
| MSCI ACWI Ex USA TR USD (Foreign Dev & EM) | 6.36% | -5.08% |
| Source: YCharts |
Commodities
Commodities also moved higher in the third quarter thanks to a declining U.S. dollar, combined with cautious optimism for an eventual global economic rebound. Oil prices were volatile in the third quarter but still finished with a positive return as OPEC maintained discipline on supply cuts which helped offset concerns about global oil demand expectations. Gold, meanwhile, added to the gains of the second quarter thanks to the weakness in the U.S. dollar, still-recovering inflation expectations and steady bond yields amid the historic global central bank stimulus.
| Commodity Indexes | Q3 Return | YTD |
|---|---|---|
| S&P GSCI (Broad-Based Commodities) | 4.61% | -33.38% |
| WTI Crude Oil | 1.00% | -35.40% |
| GLD Gold Price | 5.83% | 23.95% |
| Source: YCharts/Koyfin.com |
Bonds
Switching to fixed income markets, the total return for most bond classes was again positive in the third quarter, as bonds now have realized a positive return for each quarter so far this year. The leading benchmark for bonds, the Bloomberg Barclays US Aggregate Bond Index, saw slightly positive returns in third quarter marking the eighth consecutive quarterly gain.
Longer-duration bonds again outperformed those with shorter durations in the third quarter as global central banks (including the Federal Reserve) reiterated that rates would stay low for years to come. That anchored shorter-duration bonds, and in turn increased the appeal of higher-yielding, longer-maturity bonds.
Corporate bonds again saw solidly positive returns in the third quarter thanks to the better-than-expected economic recovery. High-yield bonds outperformed investment-grade bonds during the quarter, reflecting surprisingly strong corporate commentary during the most-recent earnings season combined with optimism that a continued decline in coronavirus cases would help business continue to recover.
| U.S. Bond Indexes | Q3 Return | YTD |
|---|---|---|
| BBgBarc US Agg Bond | 0.62% | 6.79% |
| BBgBarc US T-Bill 1-3 Mon | 0.03% | 0.52% |
| ICE US T-Bond 7-10 Year | 0.27% | 11.46% |
| BBgBarc US MBS (Mortgage-backed) | 0.11% | 3.62% |
| BBgBarc Municipal | 1.23% | 3.33% |
| BBgBarc US Corporate Invest Grade | 1.54% | 6.64% |
| BBgBarc US Corporate High Yield | 4.60% | 0.62% |
| Source: YCharts |
Final Thoughts
While short-term volatility might well reappear between now and year-end, the markets in 2020 have once again demonstrated that a long-term approach combined with a well-designed and well-executed investment strategy can overcome periods of elevated volatility, market corrections, bear markets and even global pandemics.
At McKinley Carter, we understand the risks facing both the markets and the economy, and we are committed to helping you effectively navigate this challenging investment environment. Successful investing is a marathon, not a sprint, and even intense volatility like we experienced in the first nine months of this year is unlikely to alter a diversified approach set up to meet your long-term investment goals.
Therefore, it’s critical for you to stay invested, remain patient, and stick to the plan, as we’ve worked with you to establish a unique, personal allocation target based on your financial position, risk tolerance, and investment timeline.
Finally, we thank you for your ongoing confidence and trust and please rest assured that our entire team will remain dedicated to helping you successfully navigate this market environment.
