
Volatility gripped markets in the first quarter of 2025 and the major stock indices saw declines as chaotic U.S. trade and tariff policies caused a steep plunge in business and consumer confidence, which raised concerns that economic growth would dramatically slow and corporate earnings growth would disappoint. Learn more about the key events of the quarter.
Part 1: Looking back at the first quarter
Part 2: What actions did we take in McKinley Carter portfolios last quarter?
Part 3: A look ahead - our outlook for the rest of 2025
Looking back at the first quarter
Volatility gripped markets in the first quarter of 2025 and the major stock indices saw declines as chaotic U.S. trade and tariff policies caused a steep plunge in business and consumer confidence, raising concerns that economic growth would dramatically slow and corporate earnings growth would disappoint.
In the quarter, the S&P 500 suffered its worst drop (4.27% decline) since Q3 2022, and the Nasdaq 100 declined by 8.07%. The previous optimism of possible tax cuts, corporation deregulation, and enhanced merger activity gave way to pessimism surrounding aggressive government layoffs and new inflationary concerns.
The Key Events of the Quarter
Stocks started the new year by extending the declines of late 2024, as worries the Federal Reserve could pause interest rate cuts weighed on the markets early in January. However, solid economic data, encouraging inflation readings and positive commentary from Fed officials about future rate cuts pushed back on those fears and the S&P 500 recovered much of those initial losses by mid-month. Additionally, stocks rallied into and following Inauguration Day, as investors anticipated a “pro-growth” administration taking power while fears of dramatic tariffs on “Day One” of the Trump presidency went unfulfilled. The S&P 500 hit a new all-time high shortly after President Trump’s inauguration and the rally continued into late January after the Fed signaled it still expected to cut rates in 2025, further calming fears of a pause in rate cuts. However, at the very end of January, investors got a preview of looming tariff/trade volatility when President Trump threatened 25% tariffs on Colombia. Those tariffs were not ultimately implemented. So markets largely ignored them, and stocks finished January with a solid gain.
Trade and tariff policy became a major influence on markets in February and dramatically increased market volatility by month-end. During the first few days of February, President Trump threatened and then delayed 25% tariffs on Mexico and Canada, which temporarily spiked market volatility. However, the one-month delay of those tariffs led markets to believe that President Trump was using tariff threats as a negotiating tactic and that substantial tariffs would not be implemented after all. That sentiment helped to ease investor concerns while economic data remained solid. Those factors combined to send the S&P 500 to a new all-time high on February 19th. However, the rally would not last. In late February consumer confidence declined dramatically and some economic reports implied the trade and tariff uncertainty was starting to slow economic growth. Those fears were reinforced when the Atlanta Fed’s GDPNow turned negative, implying economic growth may be stalling. Meanwhile, tariff threats and general policy volatility continued through the end of the month. Combined with plunging consumer sentiment, this sparked a “growth scare” amongst investors that weighed on stocks and sent the S&P 500 marginally lower in February.
The market declines accelerated in March as President Trump made good on his threat to implement 25% tariffs on Mexico and Canada (and an additional 10% tariff on China). President Trump delayed some of those tariffs on Mexico and Canada until early April, but many other tariffs were left in place, shattering investors’ belief that tariff threats were just a negotiating tactic. Meanwhile, several corporations from various sectors began to lower earnings guidance, citing reduced consumer spending and business investment. Those guidance cuts reinforced fears that policy uncertainty could cause an economic slowdown, and the S&P 500 fell to a six-month low. In late March, markets tried to rebound amidst a lull in tariff threats, but it didn’t last as President Trump announced 25% auto tariffs on March 26th, sending stocks lower once again. The S&P 500 finished the quarter near the year-to-date lows.
In sum, investor optimism for a pro-growth agenda and tax cuts was replaced by rising concerns about a new global trade war and a slowing U.S. economy, as policy uncertainty and ineffective communication dampened investor and consumer confidence. Fortunately, a diversified portfolio of domestic and international stocks, plus an allocation to the bond market, mitigated much of the market’s volatility in the quarter for our clients.
First Quarter Performance Review
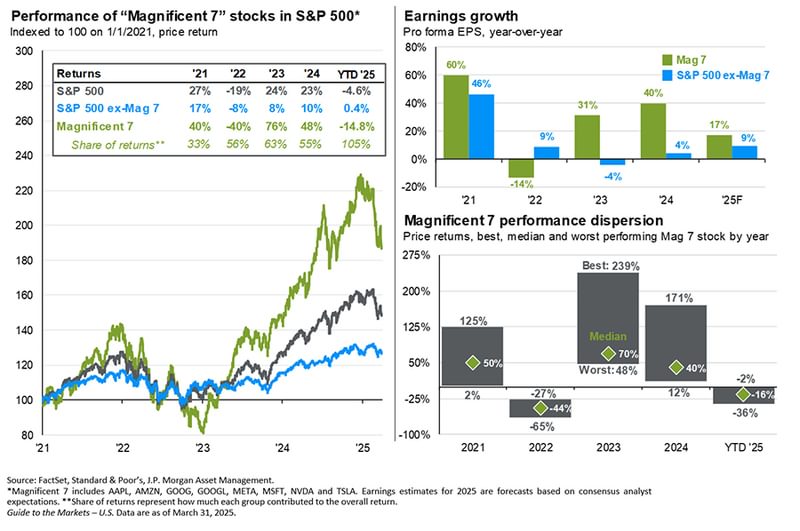
Market internals revealed that while the S&P 500 logged a moderately negative return for the quarter, the declines in the index were mostly due to sharp drops in widely held technology and consumer stocks, while other parts of the market proved resilient. While the market leaders of the past two years, the “Magnificent Seven,” experienced a sharp pullback (-14.8%) in the first quarter due to reduced future earnings expectations, the other 493 members of the S&P 500 registered a small increase for the period (0.4%).
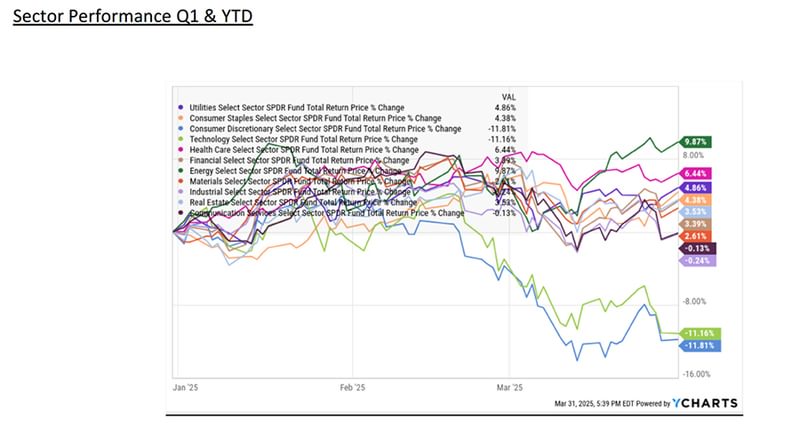
- On a sector level, only four of the 11 S&P 500 sectors finished the quarter with a negative return and two of those four sectors saw only fractional declines*. As mentioned, the consumer discretionary and tech sectors were, by far, the worst-performing sectors in the first quarter as both saw substantial declines, and since those two sectors carry some of the largest weights in the S&P 500, they weighed on the overall index performance. The consumer discretionary sector was the worst performer for the quarter as it was hit by intense weakness in one of the largest consumer stocks (Tesla) combined with general concerns about lower consumer spending in the face of policy uncertainty. The technology sector was the other substantially negative performer in the first quarter as tech stocks fell following the debut of the Chinese Artificial Intelligence (AI) program, DeepSeek, which challenged assumptions about the future economic benefit of AI for major tech firms.
- Looking at sector outperformers, energy was the top-performing sector in Q1 thanks to rising demand expectations following strong Chinese economic data and after some European countries committed to increasing debt to fund economic growth. The healthcare, utilities and consumer staples sectors logged modest gains in Q1, as those traditionally defensive sectors were viewed as more insulated from any new trade wars and tend to be more resilient in the face of an economic slowdown.
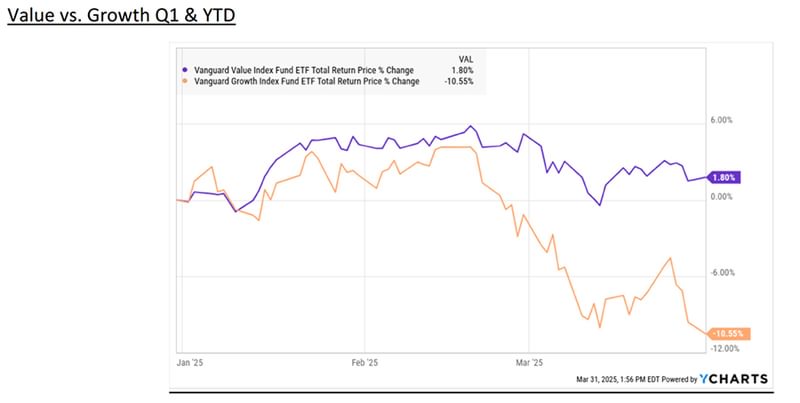
- From an investment style standpoint, value significantly outperformed growth in Q1 as growth strategies posted substantial losses due to their large weightings of tech and consumer stocks**. Value strategies logged a slightly positive return over the past three months and benefited from exposure to a broader array of sectors that traded at lower valuations and were not as impacted by the negative headlines in the first quarter.
- Finally, looking at performance by market cap, small caps declined sharply in the first quarter and lagged large caps thanks to a combination of rising worries about economic growth and still high interest rates. Large cap indices also declined in the first quarter, although those losses were more modest.
- Internationally, foreign markets massively outperformed the S&P 500 and finished the quarter with a substantially positive return. Foreign developed markets saw the largest gains and outperformed emerging markets after Germany and other EU countries signaled a willingness to increase deficit spending to boost economic growth and defense. Emerging markets logged more modest gains thanks to better-than-expected Chinese economic data.
- Commodities were modestly positive in the first quarter as strength in gold helped to boost the major commodity indices. Gold hit a new record high and traded above $3000/oz. thanks to a weaker U.S. dollar and increased demand following policy volatility from the new administration. Oil logged a small loss but finished well off the lows of the quarter thanks to better-than-expected Chinese economic data and expectations for more demand from Europe.
- Switching to fixed income markets, the leading benchmark for bonds (Bloomberg U.S. Aggregate Bond Index) realized a modestly positive return for the first quarter of 2025. Better-than-expected inflation readings and general concerns about economic growth boosted bonds broadly and helped longer-duration bonds to outperform shorter-duration bills and notes, as investors sought higher long-term yields amidst policy uncertainty.
- Turning to the corporate bond market, higher-quality but lower-yielding investment-grade bonds outperformed higher-yielding but lower-quality bonds in the first quarter, and that reflected investor concerns about future economic growth amidst policy uncertainty. However, both investment-grade and high-yield corporate bonds finished the first quarter with modest gains, reflecting a still present sense of economic optimism from bond investors.
| U.S. Equity Indexes | Q1 Return |
|---|---|
| S&P 500 | -4.27% |
| DJ Industrial Average | -0.87% |
| NASDAQ 100 | -8.07% |
| S&P MidCap 400 | -6.10% |
| Russell 2000 | -9.48% |
Source: YCharts
| International Equity Indexes | Q1 Return |
|---|---|
| MSCI EAFE TR USD (Foreign Developed) | 7.01% |
| MSCI EM TR USD (Emerging Markets) | 3.01% |
| MSCI ACWI Ex USA TR USD (Foreign Dev & EM) | 5.36% |
Source: YCharts
| Commodity Indexes | Q1 Return |
|---|---|
| S&P GSCI (Broad-Based Commodities) | 4.89% |
| S&P GSCI Crude Oil | -0.51% |
| GLD Gold Price | 19.02% |
Source: YCharts/Koyfin.com
| U.S. Bond Indexes | Q1 Return |
|---|---|
| BBg US Agg Bond | 2.78% |
| BBg US T-Bill 1-3 Mon | 1.04% |
| ICE US T-Bond 7-10 Year | 3.90% |
| BBg US MBS (Mortgage-backed) | 3.06% |
| BBg Municipal | -0.22% |
| BBg US Corporate Invest Grade | 2.31% |
| BBg US Corporate High Yield | 1.00% |
Source: YCharts
What actions did we take in McKinley Carter portfolios last quarter?
- In our Strategic Focus models, we completed our annual rebalancing program and focused on reallocating our fixed income funds to become more streamlined with the removal of a high yield bond fund and an Emerging Markets fund and adding a core intl. bond ETF.
- In our Dividend Focus models, we made changes to our international holdings to increase the dividend yield and to better align our Emerging Markets allocation to the benchmark.
- In our municipal bond allocations, we moved from passive funds to active funds. Historic returns for active muni funds have been superior to passive funds and the current interest rate environment provides for greater opportunities in the municipal bond market.
- In our ActiveTrack models, we adjusted our growth/value allocation in January to reflect a balanced approach.
- In our ActiveTrack, Earnings Focus, and Hybrid models, we reduced our international allocation to 30% of the equity position by selling some of our foreign stock positions into market strength.
- In our tactical allocation approved investments, we added a low cost gold ETF and removed the equal-weighted Nasdaq 100 ETF.
- Within our approved target outcome (hedged) ETFs, we added max buffer ETFs that allow for greater downside market protection.
A look ahead - our outlook for the rest of 2025
Two of the most often used words on companies’ earnings calls in the first quarter were “tariffs” and “uncertainty.” As we begin the second quarter, it’s prudent to reflect on what we know and what we don’t know in order to establish a baseline for the overall investment environment.
What we know:
1.) Tariffs are are currently the primary force behind economic projections and market sentiment.
On April 2nd, President Trump issued an Executive Order based on a “national emergency” including two main tariff announcements: a) 10% universal tariffs on U.S. imports with the goal of raising revenue (going into effect April 5th) and b) Higher tariff rates on 25+ of the country’s biggest trading partners based on their trade deficit with the U.S. (going into effect April 9th).
- According to J.P. Morgan, these “reciprocal” tariffs were much higher than expected, ranging from tariffs of an additional 34% on China (for a total tariff increase of 54% this year), 20% on the European Union, 24% on Japan, 26% on India and higher tariffs on Southeast Asia.
- Canada and Mexico were spared this round, as a separate USMCA discussion continues.
- These announcements added to previous tariffs: 25% on non-USMCA compliant goods from Mexico and Canada (10% on Canadian energy and 10% on potash), additional 20% on China, 25% on steel and aluminum and 25% on imported autos and auto parts.
- On Friday, April 4th, China announced retaliatory tariffs of 34% on all U.S. goods.
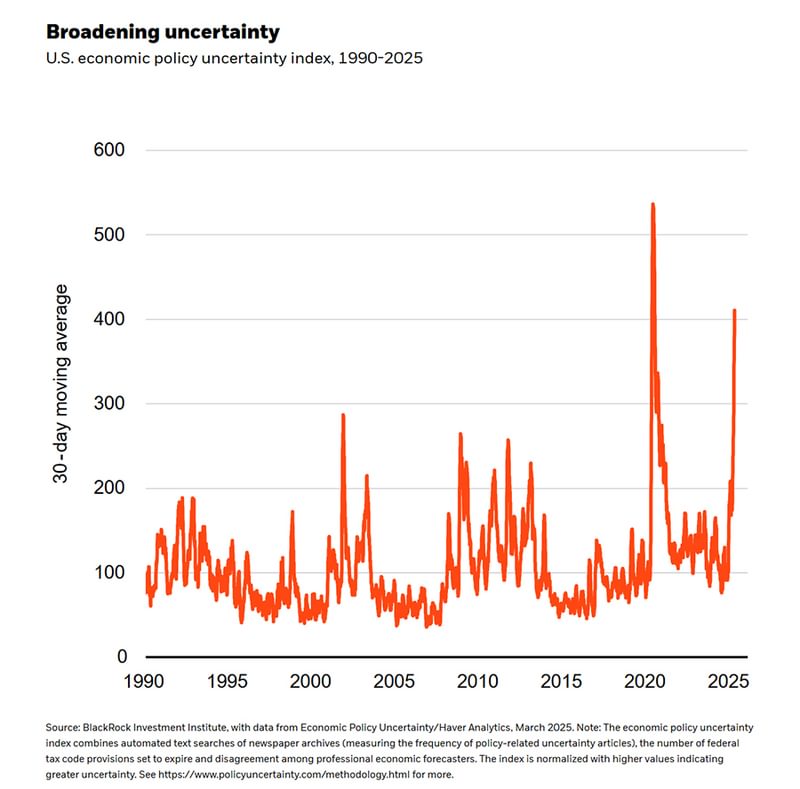
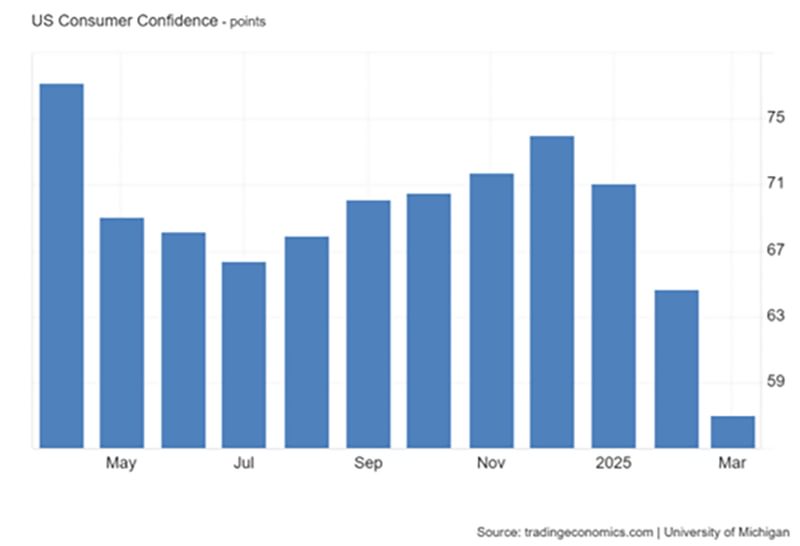
2.) Consumer confidence data has been declining sharply, likely due to tariff concerns and massive government employee layoffs.
3.) Employment data and unemployment claims remain constructive
4.) The Federal Reserve has indicated that they are not ready to further lower the Fed Funds rate
5.) Inflation data are not improving
6.) Interest rates have dropped sharply
7.) International stocks have been ouperforming U.S. stocks this year, helped by a declining U.S. dollar
What we don’t know:
1.) Whether tariffs will significantly constrain economic growth (and corporate earnings) and be inflationary (or stagflationary)
2.) Whether reduced immigration will lead to increasing wage costs, adding to inflation
3.) Whether the growth of Artificial Intellience (AI) will lead to near-term productivity gains and potentially enhance corporate profitability
4.) Whether deregulation will accelerate merger and acquisitions activity this year
5.) What level of tax cuts will be approved in 2025?
6.) Will the Federal Reserve be more aggressive than expected in lowering rates?
7.) Whether international stocks will continue to lead U.S. stocks for the remainder of 2025
Because of hightened uncertainty in the investment markets, our position on the markets continues to be driven by the “three legs of the investment stool:” inflation, interest rates, and earnings. These fundamental drivers of the economy determine the ultimate direction of stock and bond prices.
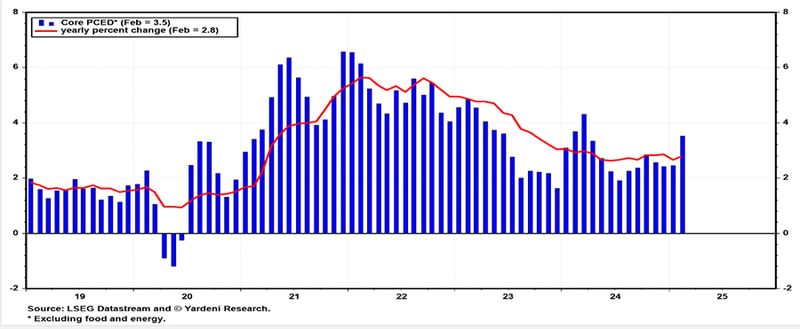
Inflation
The Federal Reserve’s favorite gauge of inflation is the Core (ex food and energy) Personal Consumption Expenditures Index (PCE) due to its broad scope of business surveys. Recently, the PCE data has stopped declining and is still above the Fed’s 2.0% target. While significant progress has been made in lowering the Core PCE, its current level remains problematic for the Fed and may be pressured upward by the newly announced tariffs. The direction of inflation can influence both bond and stock prices by affecting interest rates and stock market valuations. This leg of the investment stool is a bit “wobbly” and likely means the Fed will not lower rates to support markets unless unemployment data deteriorate from here.
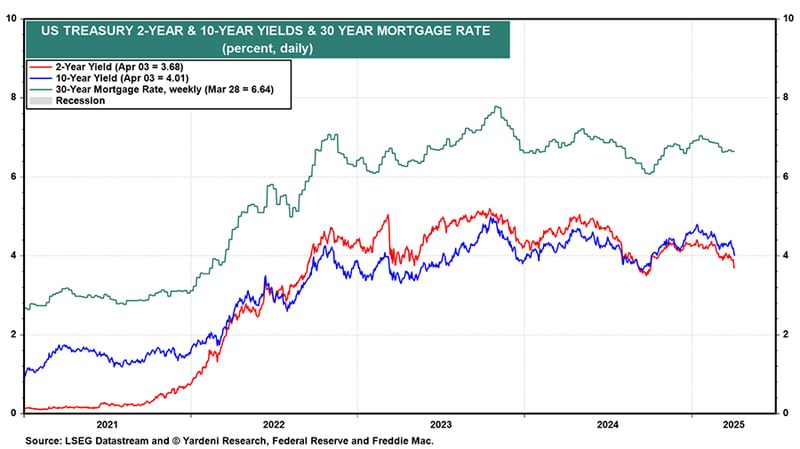
Interest rates
Interest rates have fallen sharply as concerns over the potential economic fallout of tariffs have led to economists reducing 2025 GDP growth projections.

Falling interest rates have been a boon to bond prices and have served as reduced competition for stock prices, but may foreshadow a slowing economy and slower corporate earnings growth. This leg of the investment stool is mildly suportive of both stock and bond prices at current levels.
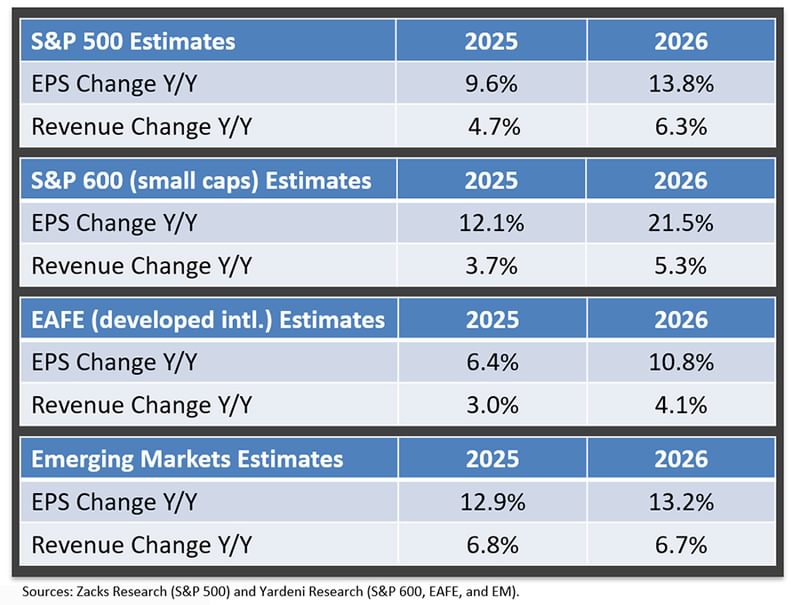
Earnings
Corporate earnings projections are strong for both 2025 and 2026. Both domestic and international earnings estimates reflect a growing global economy.
However, recent earnings revisions have been negative and serve as a worrisome sign for calendar year estimates moving forward.
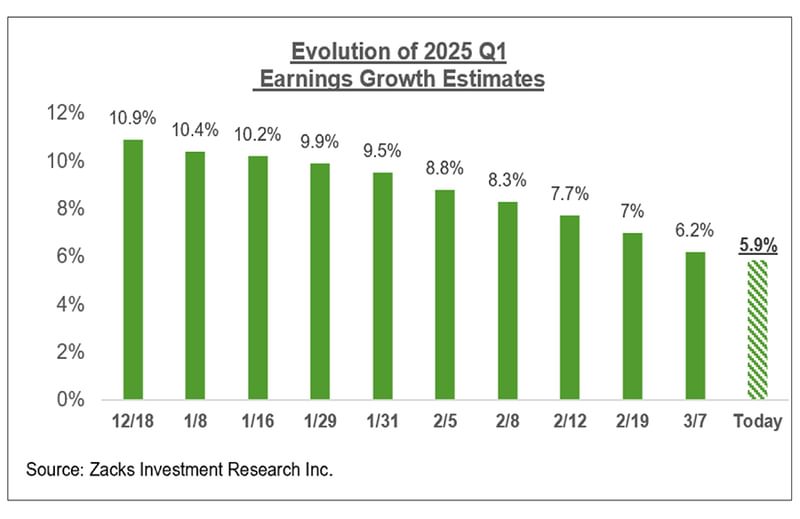
While current earnings projections for this year and next remain supportive of stock prices at current levels, we remain attentive to any further negative revisions. This leg of the investment stool is less solid than before the Trump administration’s tariffs were announced and warrants caution.
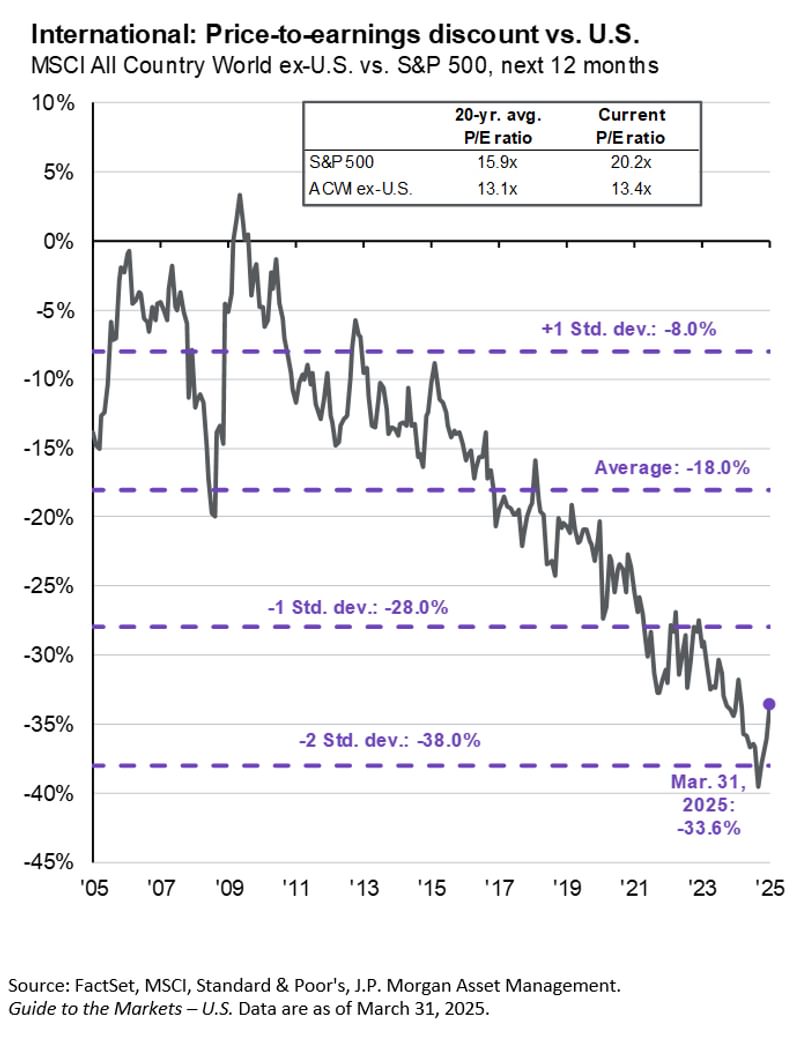
Taken together, the three legs of the markets’ investments stool are modestly supportive of stock and bond prices. The recent sharp pullback in the stock market has presented long-term investors with an opportunity to establish positions at cheaper valuations than earlier in the year. That said, we are cautious on the U.S. stock market in the near-term as the full impact of tariffs on corporate earnings has not been felt at this point. However, international stocks are still quite reasonably valued despite their outperformance in the first quarter.
Bond prices may be range bound this year but provide good income streams at current levels. Additionally, bonds can serve as an effective portfolio diversifier in the event of equity market disruptions like we are currently experiencing.
Bottom line, the first quarter did contain several negative surprises for investors, and we begin the second quarter with significant uncertainty on trade policies and legitimate concerns about future economic growth. But in the tug of war between negatives (poor investor sentiment and declining GDP data) and positives (signs of a still healthy consumer and low unemployment), there are other factors at work that must be considered such as modest interest rates and looming positive economic policies such as deregulation and potential tax cut extensions. So, despite depressed investor sentiment, the outlook for the economy and markets is not without a potential silver lining later in the year.
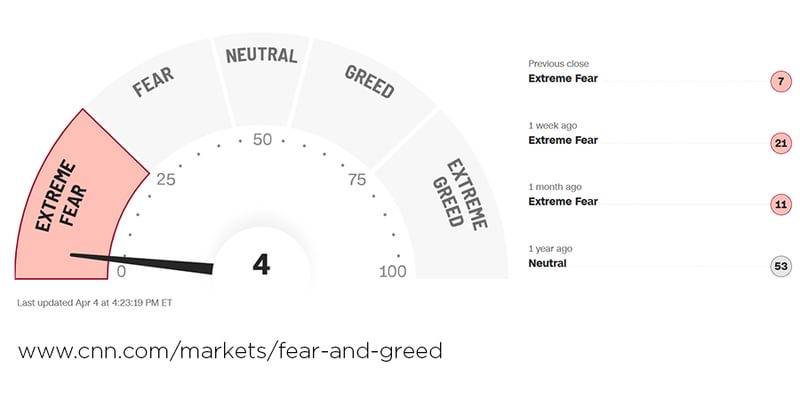
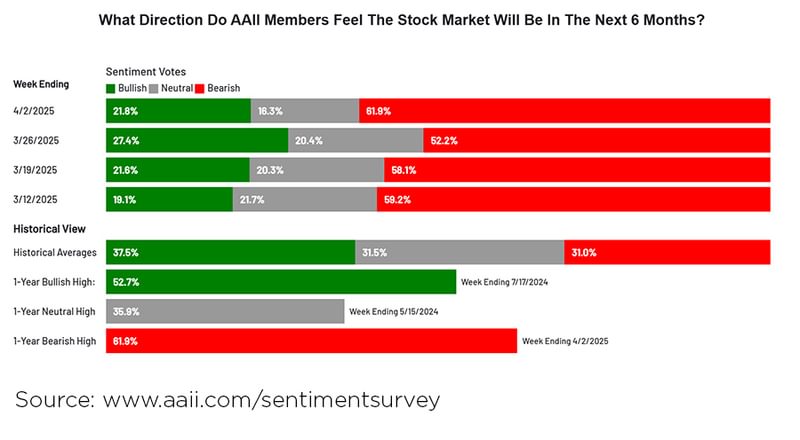
Finally, stock market participants are excessively pessimistic by historic standards. Both the CNN Fear and Greed Index and the American Association of Individual Investors (AAII) survey reflect levels of pessimism often seen near the end of market selloffs. While we can’t be sure that this scenario will unfold in the near term, buying into periods of extreme weakness and negativity is often rewarded over time.
Additional Resources:
*Sector Performance Graph / YCharts
**Growth v. Value Graph / YCharts