Note: This information is from 2022 but much has changed since then. Please be sure to discuss your unique financial situation with your McKinley Carter Advisor or another trusted professional.

Our Senior Investment Strategist Dave Nolan provides a look back at 2Q2022 and the actions taken by McKinley Quarter. In the latter part of his investment report, Dave offers an outlook for the remainder of 2022.
Part 1: Looking back at Q2 2022
Part 2: What actions did we take in McKinley Carter portfolios in Q2?
Part 3: A look ahead - our outlook for the rest of 2022
Looking back at Q2 2022
In the poem Invictus written in 1875 by British poet William Earnest Henley, two lines that stand out for us are the following,
“Under the bludgeonings of chance
My head is bloody, but unbowed.”
These lines effectively capture our feelings concerning the markets in the first half of 2022 and the prospects for the second half of the year. Despite the damage done in both stock and bond markets through June 30th, we believe the second half may ultimately offer a reprieve from further downside as inflation likely eases and markets, having already priced in a dramatic slowdown in the economy, stabilize and begin to look through the current economic turmoil to better times ahead.
With most major domestic and international stock market indexes having fallen more than 20% from their highs, these indexes have entered what is referred to as a “bear market.” This year has been especially painful for investors as even bonds have been under intense pressure with losses exceeding 13% at one point. The S&P 500 realized its worst first-half performance since 1970 as market headwinds of inflation levels not seen in four decades, sharply rising interest rates, growing recession risks, and extreme geopolitical uncertainty, pushed stocks and bonds sharply lower. The Russian invasion of Ukraine which has destabilized the global oil and grain markets, and the zero-COVID policy of the Chinese government further exacerbated stalled supply chains. Additionally, coming into this year, stock prices were elevated after a strong 2021.
This perfect storm of events has led to concerns of both ongoing inflation and the possibility of recession, sometimes referred to as “stagflation.”
On June 10th, the May CPI report showed inflation had not yet peaked as CPI rose 8.6% year-over-year, the highest reading since 1982. That prompted a violent reversal of the late-May gains, and the selling and market volatility was compounded when the Federal Reserve increased interest rates by 0.75% on June 15th, the biggest rate hike since 1994. Additionally, Fed Chair Powell again warned that similar rate hikes are possible in the coming months. The high CPI reading combined with the greater-than-expected rate hike hit stocks hard, and the S&P 500 dropped sharply in mid-June to its lowest level since December 2020. During the last two weeks of the quarter, markets stabilized as commodity prices declined while U.S. economic readings showed a clear moderation in activity and that rekindled hope that a peak in inflation and an end to the rate hike cycle might come sooner than feared. Those factors, combined with the fact that markets had become near-term oversold again, resulted in a modest bounce late in the month, but the S&P 500 still finished with a solidly negative return to close out the first half.
Second Quarter Performance Review
Highlights:
- All four major stock indices posted negative returns for the second straight quarter, and like in the first quarter, the tech-heavy Nasdaq underperformed primarily thanks to rising interest rates while the Dow Jones Industrial Average relatively outperformed.
- By market capitalization, large-cap stocks again outperformed small-cap stocks in the second quarter, although the performance gap was small. Large-cap outperformance continued to be driven by the rise in interest rates as well as growing recession fears.
- From an investment style standpoint, both value and growth registered losses for the second quarter, a departure from the first quarter where value posted a positive return. However, value did again handily outperform growth on a relative basis in the second quarter.
- On a sector level, all 11 S&P 500 sectors finished the second quarter with negative returns. Relative outperformers included traditionally defensive sectors such as utilities, consumer staples, and healthcare, which are historically less sensitive to a potential economic slowdown, and the quarterly losses for these sectors were modest. Energy was also a relative outperformer thanks to high oil and gas prices for much of the second quarter, although a late-June drop in energy commodities caused the energy sector to finish the quarter with a small loss.
- Sector laggards in the second quarter were similar to those in the first quarter, with communication services, tech, and consumer discretionary sectors seeing material declines due to the broad rotation away from the more highly valued corners of the market. Specifically, internet again weighed on the communications sector, while traditional retail stocks were a drag on the consumer discretionary sector following unexpectedly bad earnings from several major national retail chains. Financials also lagged in the second quarter thanks to rising fears of a future recession combined with a flattening yield curve, which can compress bank profit margins.
- Internationally, foreign markets declined in the second quarter as the Russia-Ukraine war continued with no signs of a ceasefire in sight. However, foreign markets outperformed U.S. markets as foreign central banks are expected to be less aggressive with future rate increases compared to the Fed. Emerging markets outperformed foreign developed markets thanks to high commodity prices (for most of the quarter) and despite rising global recession fears.
- Commodities registered slightly negative returns in the second quarter thanks mostly to steep declines in late June. Fears of a global recession hit most commodities at the end of the quarter and erased what was, up to that point, a solidly positive performance for the broader commodity complex. Oil finished the quarter with a small loss. Gold, meanwhile, logged negative returns despite the increase in market volatility and multi-decade highs in inflation, as the strong dollar and rising real interest rates weighed on the yellow metal.
- Switching to fixed-income markets, most bond indices again registered negative returns as still-high inflation and the prospect of faster-than-expected rate increases from the Fed weighed on fixed-income investments. Looking deeper into the bond markets, shorter-term Treasury Bills again outperformed longer-duration Treasury Notes and Bonds as high inflation and the threat of more than previously expected Fed rate hikes weighed on fixed income products with longer durations. Short-term Treasury Bills finished the quarter with a slightly positive return.
- Corporate bonds underperformed in the second quarter as rising recession fears paired with already-high inflation weighed considerably on corporate debt. For much of the quarter, high-quality investment-grade bonds and lower-quality high yield corporate bonds had similar negative returns, implying investor concerns about a future recession were general in nature. However, an increase in disappointing economic data hit high-yield corporate bonds at the end of the quarter and they underperformed their higher-quality counterparts.
| U.S. Equity Indexes | Q2 Return | YTD |
|---|---|---|
| S&P 500 | -17.41% | -19.96% |
| DJ Industrial Average | -12.17% | -14.44% |
| NASDAQ 100 | -23.50% | -29.22% |
| S&P MidCap 400 | -16.62% | -19.54% |
| Russell 2000 | -18.02% | -23.43% |
Source: YCharts
| International Equity Indexes | Q2 Return | YTD |
|---|---|---|
| MSCI EAFE TR USD (Foreign Developed) | -15.15% | -19.25% |
| MSCI EM TR USD (Emerging Markets) | -11.92% | -17.47% |
| MSCI ACWI Ex USA TR USD (Foreign Dev & EM) | -14.34% | -18.15% |
Source: YCharts
| Commodity Indexes | Q2 Return | YTD |
|---|---|---|
| S&P GSCI (Broad-Based Commodities) | -1.62% | 35.80% |
| WTI Crude Oil | -1.78% | 41.43% |
| Gold Price | -5.88% | -1.28% |
Source: YCharts/Koyfin.com
| U.S. Bond Indexes | Q2 Return | YTD |
|---|---|---|
| BBgBarc US Agg Bond | -4.63% | -10.35% |
| BBgBarc US T-Bill 1-3 Mon | 0.12% | 0.16% |
| ICE US T-Bond 7-10 Year | -4.00% | -10.53% |
| BBgBarc US MBS (Mortgage-backed) | -3.98% | -8.78% |
| BBgBarc Municipal | -2.77% | -8.98% |
| BBgBarc US Corporate Invest Grade | -7.16% | -14.39% |
| BBgBarc US Corporate High Yield | -9.78% | -14.19% |
Source: YCharts
What actions did we take in McKinley Carter portfolios in Q2?
May
We reduced our international allocation due to elevated global economic uncertainty. A strong U.S. dollar, ongoing supply chain issues compounded by rolling COVID shutdowns in China, plus European energy and food supply concerns brought about by the war in Ukraine led the committee to reduce our international stock exposure from 36% of total equities to 31%. The allocation to Emerging Markets, as a percentage of total international holdings, remains the same though our China exposure was reduced due to concerns over ongoing COVID shutdowns.
In our ActiveTrack (AT) programs, we replaced ARK Innovation (ARKK) and Vanguard International Growth Fund (VWILX) with Invesco NASDAQ Next Gen 100 ETF (QQQJ) and iShares Russell Top 200 ETF (IWL), respectively.
In our Earnings Focus (EF) programs, we replaced ARK Innovation (ARKK) and Vanguard International Growth Fund (VWILX) with Invesco NASDAQ Next Gen 100 ETF (QQQJ) and Vanguard Russell 1000 Value Index Fund ETF (VONV), respectively.
While both QQQJ and ARKK are categorized as mid cap growth funds, ARKK has a beta (volatility) 36% greater than QQQJ and significant concentration risk due to a limited number of holdings. While the Strategy Committee wants to maintain exposure to “Next Generation” innovative companies, we prefer a more diversified portfolio than is found in ARKK. ARKK’s recent poor ranking in our Fi360 scoring system led us to also remove it as an approved Tactical list holding.
We also added the Schwab U.S. Dividend Equity ETF (SCHD – 3.2% yield, 0.06% ER, 5 Stars Silver) to the approved Tacticals list in order to include a higher yielding equity fund option.
June
In all our taxable fixed income models, we moved 25% of our iShares 1-5 Year Investment Grade Corporate Bond ETF (IGSB) position to the iShares Core U.S. Aggregate Bond ETF (AGG) in order to increase the quality of our bond portfolios in a slowing economy as well as to take advantage of longer-term bond yields having moved up.
In all taxable accounts, we began a program of tax loss harvesting in fixed income holdings to realize capital losses in accounts while maintaining fixed income allocations through the use of approved substitutes.
In EF models, the Vanguard Energy Index ETF (VDE) was added to the U.S. equities allocation to bring our energy exposure up to a market weight from its current underweight position. While energy ETFs (such as the Energy Select Sector SPDR ETF – XLE found in our current tactical sleeve options) have done exceptionally well this year, the Committee felt that maintaining an underweight position in the energy sector for EF models was, in effect, making a bet that energy prices will drop despite the limited production capacity available and evidence that China is beginning to reopen their economy. Having a neutral energy weighting in EF models brought us closer to the current energy weighting found in ActiveTrack models. The Vanguard Russell 1000 Value Index ETF (VONV) was reduced to fund the new allocation.
A look ahead - our outlook for the rest of 2022
As investors wrestle with the current anxieties in the economy and the stock and bond markets, uncertainty seems to be the prevalent theme.
With this as the current market backdrop, investors are asking three basic questions:
- When will the stock market bottom?
- When will inflation peak?
- Are we going into a recession?
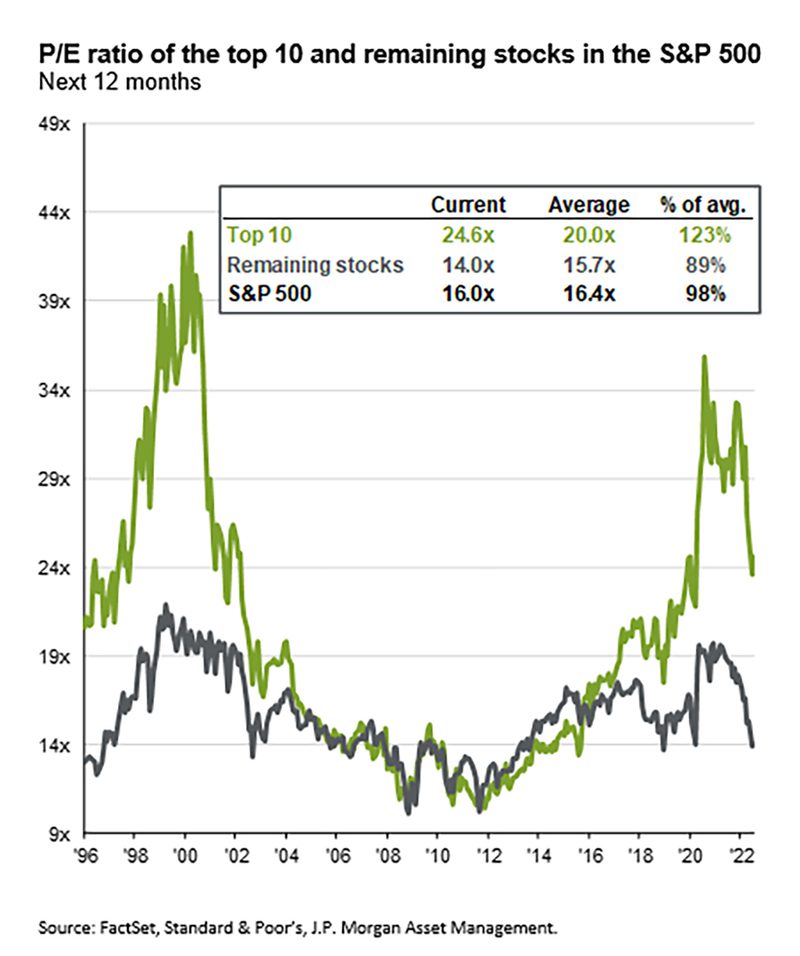
1) Regarding the stock market, since 1928, the S&P 500 has experienced 26 bear markets. The average decline was 36%, and the average length of time was 289 days. While there is no way to determine the exact date of the equity markets hitting bottom, we believe that U.S. and international indexes will stabilize once clear signs of inflation peaking are seen. Also, with stock valuations based on forward-looking earnings projections for the S&P 500 falling below their historic average and international stocks trading at even lower valuations, any additional confidence in those earnings forecasts will likely lead to more stable stock prices. Conversely, investors may react negatively if earnings estimates are reduced and valuation accuracy is questioned.

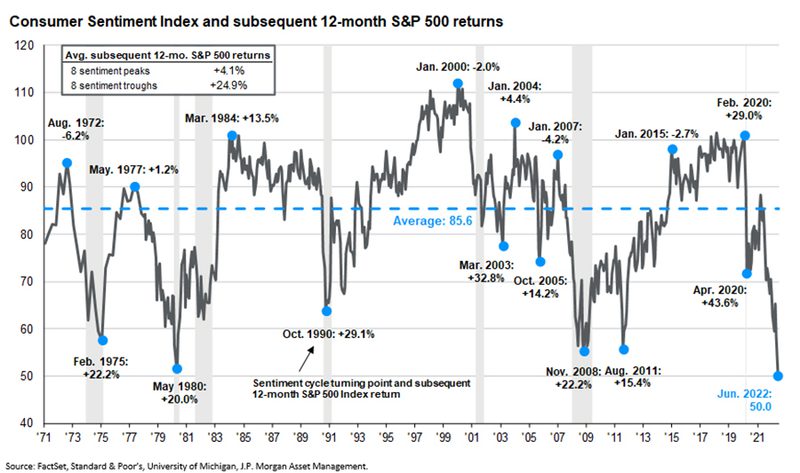
From a contrarian standpoint, a poor reading on the most recent University of Michigan Consumer Sentiment Survey may serve as a leading indicator of rising future stock prices. The Consumer Sentiment Index for June showed a reading of 50, well below its historic average of 86, and a new all-time low for the survey. When the survey results have reflected this level of excessive pessimism in the past, subsequent 12-month returns for the stock market have been quite strong.

2) As to when inflation is going to peak, inflation data has remained stubbornly high this year as energy, food, housing, and other related costs continue to squeeze consumers. The Russian war with Ukraine has clearly created major dislocations in the oil and gas markets, and has also disrupted food supplies, fertilizer production, and further obstructed global shipping routes. Unfortunately, a protracted conflict is a real possibility and may maintain pressure on prices for an extended period. However, any resolution to the crisis would likely provide immediate relief to the food and energy component of the Consumer Price Index.
Additionally, the ongoing China zero-COVID policy has caused multiple disruptions to global supply chains as the Chinese government has been quick to shut down entire cities at the first sign of a COVID outbreak. Any signs of COVID lockdowns abating in China will likely bode well for easing supply chain bottlenecks and therefore reducing pricing pressures as more goods become available.
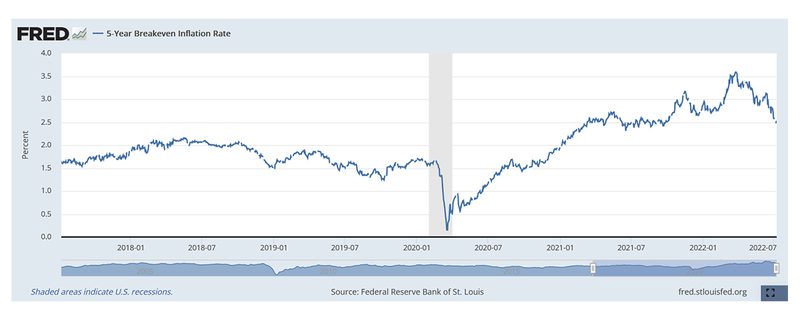
Further, the Federal Reserve has been slow to attack inflation but is now raising interest rates aggressively to curb consumer demand. Now that the Fed is laser-focused on fighting inflation, markets have reduced 5-yr. inflation expectations. Commodities such as natural gas, lumber, copper, steel, wheat, corn, and cotton have seen significant drops in price recently. This is certainly an important change in investor psychology that may help stabilize markets. The markets now seem to be more concerned with whether the Fed will overshoot on hiking interest rates and put the economy into recession.

3) There is little question that economies around the globe are seeing lowered GDP forecasts and risks are rising as central banks increase interest rates to fight inflation. The question regarding whether the U.S. is going into recession is an important one as it directly impacts corporate earnings projections and therefore the stock market. The official arbiter of determining recessions is the National Bureau of Economic Research and they consider multiple factors, not just GDP, in determining whether we are in a recession. Despite historically low consumer confidence today, unemployment is near historic lows, and wages are rising at the fastest rate in 40 years. Consumers are still traveling and spending money and their personal balance sheets are still healthy.
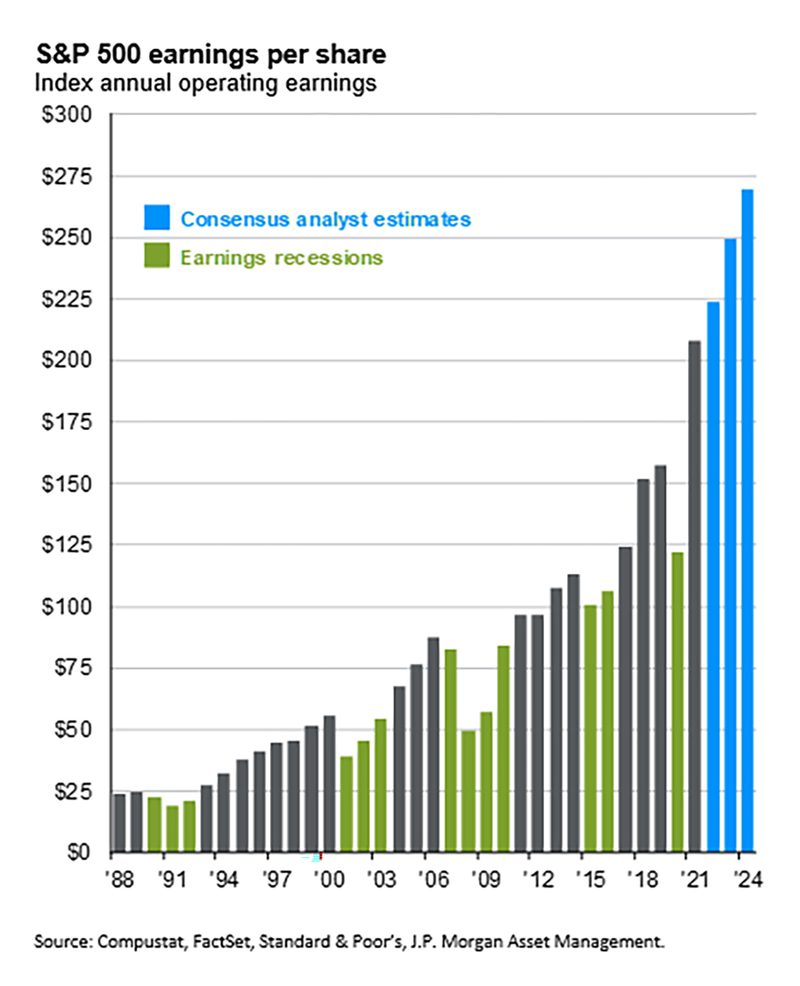
In addition, while we are monitoring corporate earnings projections for any changes, overall estimates for the next two years remain strong despite some recent negative revisions. Corporations are also flush with cash and have been increasing stock dividends and stock buybacks at a brisk pace.

In sum, there are no certainties when it comes to forecasting when the stock market might bottom, when inflation will peak, and when the next recession will come.
However, when one considers the already significant pullback in the stock and bond markets (bond yields are the highest since 2018) combined with a financially sound banking system, corporations flush with cash, a global Purchasing Managers’ Index still indicating expansion (50+), likely peaking inflation in 2022, and a consumer that has both rising wages and multiple job opportunities, we believe that patient long-term investors will be rewarded from these levels.

As markets tend to discount expected future events, we believe that the extremely pessimistic forecasts for economic growth and inflation have, to a considerable extent, been factored into current prices and any good news will likely lead to positive returns from here.
